
Series of blog posts show progress of updating/adding to EKS Cluster, this post covers adding namespaces to port-forwarding for visuals to Prometheus, Metrics Server, Thanos, Loki, Tempo, & Grafana. See below for past posts:
- Previous Posts in the Series:
- Github Repo:
Required Commands to Start:
1. cd infra2. terraform apply3. aws eks update-kubeconfig \ --region us-east-1 \ --name say-when-east4. kubectl get nodes5. kubectl get pods -n argocd OR K9s6. kubectl get applications -n argocd -w OR use K9s7. kubectl port-forward -n argocd svc/argocd-server 8080:80-----------------------------------------------8. Terraform destory9. aws eks list-clusters --region us-east-110. terraform state list
Optional Commands to Use:
1. cd gitops2. helm upgrade --install argocd argo-cd \ --repo https://argoproj.github.io/argo-helm \ --namespace argocd \ --create-namespace \ --version 7.1.03. kubectl apply -f application-bootstrap.yaml4. kubectl rollout restart -n argocd deploy/argocd-repo-server
Commands that helped Throughout:
1. kubectl annotate application <xyz> \ -n argocd \ argocd.argoproj.io/refresh=hard \ --overwrite2. kubectl get nodes3. kubectl get pods -n argocd OR K9s4. kubectl get applications -n argocd
Areas that grinded me’ gearzz:
- Making every component small, autoamted, reproductable enough to run on a 3-node t4g.small EKS cluster — was the hard part.
- Getting Kubernetes running wasn’t the hard part.
Node & Memory Hogging:
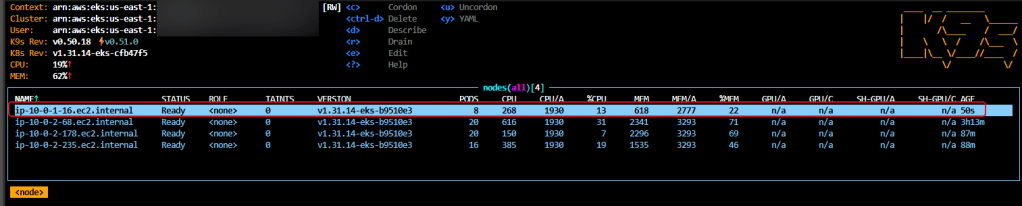
- Noticed after expanding Nodes to 3 & keep to my t4g.small EKS cluster i was having pods still go to certain loads. Meaning a node had 89% of the memory usage….
- So i wanted to see what pods were hogging all the memory! Which added some “soft-scheduling” in the mix cuz cordons is for maintence & taints/tolerations are for dedicating nodes to workload classes.
- Added “scheduleAnywasy” instead of a hard “DoNotSchedule: cuz created Pending pods & i only have a 3 node small cluster & can cause imbalance.
1. kubectl top nodes2. kubectl top pods -A --sort-by=memory3. In k9s shift arrow right or left & then shift-o


- Added “scheduleAnywasy” instead of a hard “DoNotSchedule: cuz created Pending pods & i only have a 3 node small cluster & can cause imbalance. Also expanded the Argocd-Repo-Server memory just-in-case cuz it was the blonde girl at the lunchroom.
topologySpreadConstraints:
- maxSkew: 1
topologyKey: kubernetes.io/hostname
whenUnsatisfiable: ScheduleAnyway
labelSelector:
matchLabels:
app.kubernetes.io/name: argocd-server
---------------------------------------------------------
topologySpreadConstraints:
- maxSkew: 1
topologyKey: kubernetes.io/hostname
whenUnsatisfiable: ScheduleAnyway
labelSelector:
matchLabels:
app.kubernetes.io/name: argocd-application-controller
repoServer:
replicas: 1
resources:
requests:
cpu: 50m
memory: 160Mi
limits:
cpu: 300m
memory: 384Mi
topologySpreadConstraints:
- maxSkew: 1
topologyKey: kubernetes.io/hostname
whenUnsatisfiable: ScheduleAnyway
labelSelector:
matchLabels:
app.kubernetes.io/name: argocd-repo-server
---------------------------------------------------------
topologySpreadConstraints:
- maxSkew: 1
topologyKey: kubernetes.io/hostname
whenUnsatisfiable: ScheduleAnyway
labelSelector:
matchLabels:
app.kubernetes.io/name: argocd-applicationset-controller
ArgoCD on Sum Bull$hi-…. & Prometheus Leftover Scraps:
- ArgoCD was showing OutOfSync & then causing some Prometheus resources as the same thing. Kube-Prometheus-Stack kept saying out of sync, but healthy & was worried it would affect the other resources & services. Below is the basic flow of – what had happen was…
OutOfSync
↓
Find which resources are OutOfSync
↓
Verify they’re actually Healthy
↓
Open Argo UI Diff
↓
Identify exact field drift
↓
Ignore only those fields with jqPathExpressions
↓
RespectIgnoreDifferences=true
↓
Synced / Healthy
- So I found the culprits in ArgoCD UI these 2…
- grafana-sc-dashboard
- grafana-sc-datasources
ignoreDifferences: grafana-sc-dashboard grafana-sc-datasources node-exportersyncOptions: - RespectIgnoreDifferences=true
- Found in documentation to add this

ignoreDifferences: - group: apps kind: Deployment name: kube-prometheus-stack-grafana namespace: monitoring jqPathExpressions: - '.spec.template.spec.containers[] | select(.name == "grafana-sc-dashboard") | .resources' - '.spec.template.spec.containers[] | select(.name == "grafana-sc-datasources") | .resources' - group: apps kind: DaemonSet name: kube-prometheus-stack-prometheus-node-exporter namespace: monitoring jqPathExpressions: - '.spec.template.spec.containers[] | select(.name == "node-exporter") | .resources'

- ArgoCD applied CRDs client-side. So large CRDs & to fix drift was:
syncOptions: - ServerSideApply=true - Replace=true - RespectIgnoreDifferences=true
Prometheus:


1. kubectl port-forward svc/kube-prometheus-stack-prometheus \-n monitoring 9090:90902. http://localhost:90903. Metrics to query- node_cpu_seconds_total- node_memory_MemAvailable_bytes- container_memory_working_set_bytes- kube_pod_status_phase

Grafana:
1. kubectl port-forward svc/kube-prometheus-stack-grafana -n monitoring 3000:802. http://localhost:3000

1. : SVC - shift-F2. : secrets - x

.tfvars vs variables, omg…
- The modules pulled had some over-riding occuring cuz when updating the EKS Cluster forgot the .tfvars were overiding variables.tf for the change in:
- Nodes
- Scaling sizes
- Cluster Version
- Helm-Charts in Prometheus, Thanos, etc.
aws eks update-nodegroup-config \ --cluster-name say-when-east \ --nodegroup-name default-2026081412101032660000000f \ --region us-east-1 \ --scaling-config minSize=2,maxSize=3,desiredSize=3
CLI Commands vs K9s:
- Both helpful, but found K9s easier to visualize & use
- Whereas the documentation was nice to find the commands…just took time to alter my at home-lab specifics to the docx.
aws eks describe-cluster \--name say-when-east \--region us-east-1 \--query 'cluster.version' \--output text
Thanos Storage & Docker Image Fiasco:
- EBS CSI Driver & GP3 Storage for Thanos-storagegateway was not enough & i was getting THROTTLED.
- PVC kept pending & had to add CIS controller, daemonset, & IRSA
- https://github.com/earpjennings37/say_when_infra/blob/main/ebs-csi.tf
- IRSA was added fine, but had it under a sub folder for my iam.tf & policy.tf — so AWS was struggling connecting
query: serviceAccount: annotations:storegateway: serviceAccount: annotations:
- Kept getting ImagePullBackOff cuz Bitnami moved images from docker.io/bitnami to docker.io/bitnamilegacy…
- So we changed that targetURL..
- So now the sequence is after Terraform Apply
- → Argo CD installs
- → Bitnami OCI repo already registered
- → monitoring-root reads Git
- → Thanos deploys
repositories:
bitnami-oci:
name: bitnami-oci
type: helm
url: registry-1.docker.io/bitnamicharts
enableOCI: "true"
- Thanos Query Resources & Limts were altered:
resources: requests: cpu: 50m -- > 25m memory: 128mi -- >64Mi limits: cpu: 50m --> 100m memory: 256mi -- >128Mi

- Thanos Storage Reqources & Limits were altered:
resources:
requests:
cpu: 50m --> 100m
memory: 256 mi--> 128Mi
limits:
cpu: 300 --> 150m
memory: 512 --> 256Mi

Loki Thorns in the Side:
- Loki Schema Validation Failure, even ephemeral non-persistent deployments require:
loki: useTestSchema: true
- Loki CrashLoopBackOff, just disable persistence does NOT create writable storage
singleBinary: persistence: enabled: false extraVolumes: - name: loki-data emptyDir: {} extraVolumeMounts: - name: loki-data mountPath: /var/loki
- Loki Memory was exhausted, default chart enabled chunks, results, & mem-cache
chunksCache: enabled: falseresultsCache: enabled: falsetest: enabled: falselokiCanary: enabled: false
Screenshots of Visuals Once Er’ Thang was up & Running:
- Loki
1. kubectl port-forward svc/loki \-n monitoring 3100:31002. http://localhost:3100/ready
- Tempo
1. kubectl port-forward svc/tempo \-n monitoring 3200:32002. http://localhost:3200/ready
- Thanos
Thanos Query1. kubectl port-forward svc/thanos-query -n monitoring 10902:90902. http://localhost:10902http/targetsQueries3. http://localhost:10902/metricsThanos Store Gateway1. kubectl port-forward svc/thanos-storegateway -n monitoring 9091:90902. http://localhost:9091/-/healthy
- ArgoCD All Syncin Yo:

1. kubectl get applications -n argocdNAME SYNC STATUS HEALTH STATUSbootstrap-root Synced Healthykube-prometheus-stack Synced Healthyloki Synced Healthymetrics-server Synced Healthymonitoring-root Synced Healthytempo Synced Healthythanos Synced Healthy