Goal:
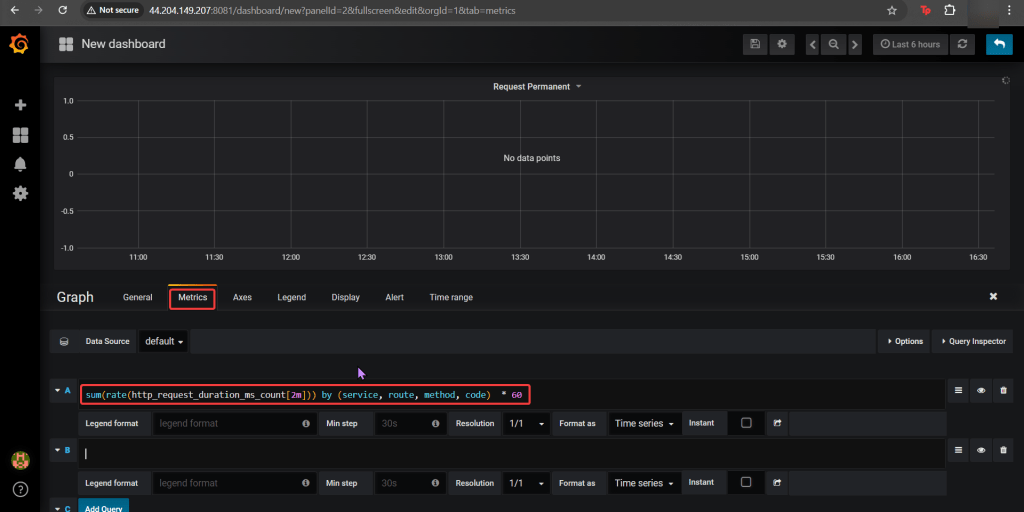
Imma monitor a CI/CD pipeline w/3 tools, wanna see if we use Prometheus to synthesize the data & Grafana to display the data? Our goal is get some insight on performance dawg!
Lessons Learned:
- Use Helm to install Grafana
- Install Prometheus in Kubernetes Cluster
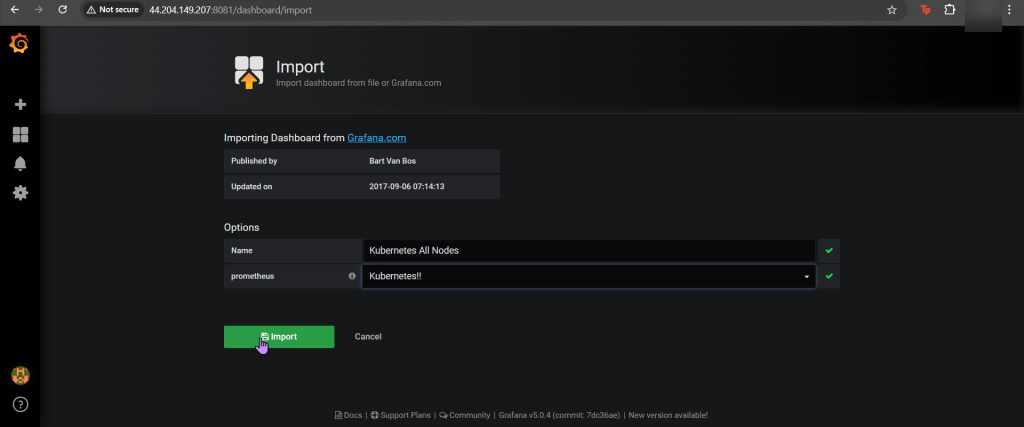
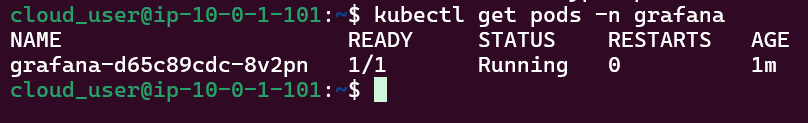
- Install Grafana in Kubernetes Cluster
Use Helm to install Grafana
SSH into Master Public IP:
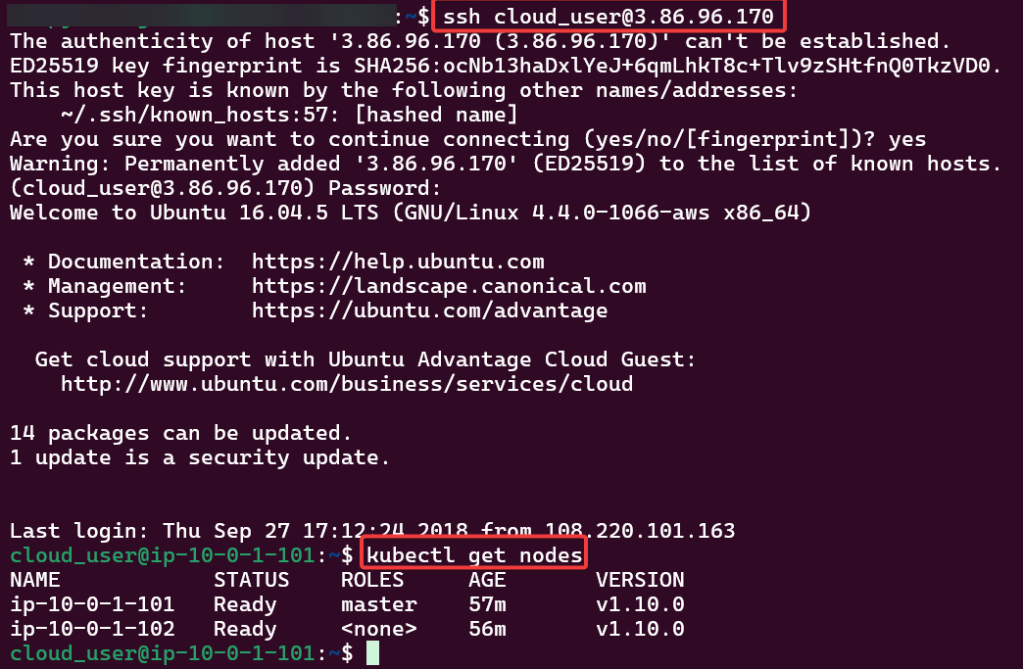
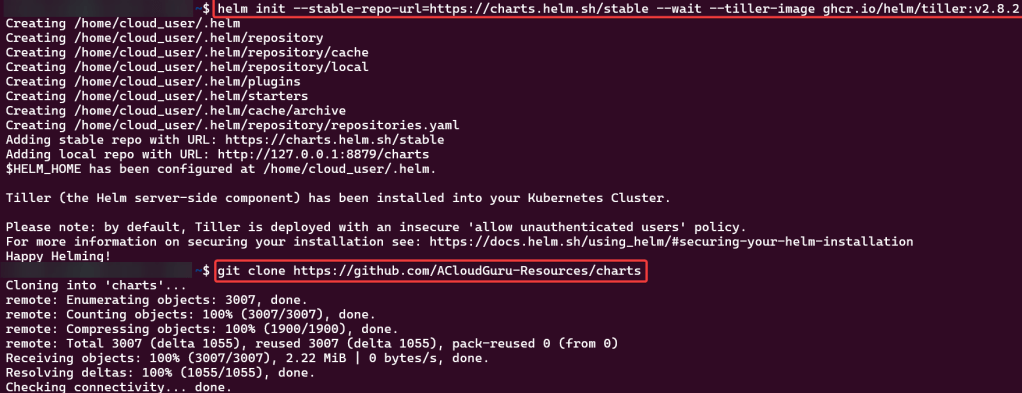
Initiate Helm:
Install Prometheus in Kubernetes Cluster
Create Prometheus YAML File:

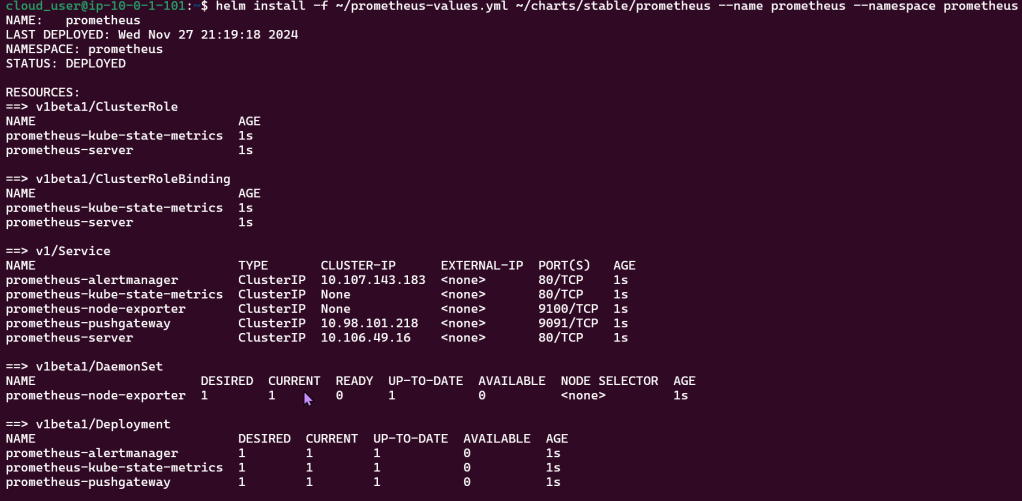
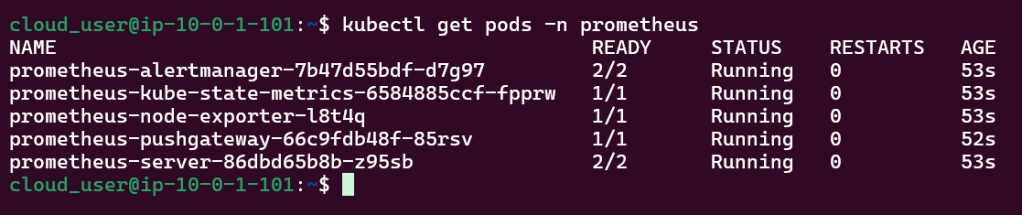
Install Prometheus:
Install Grafana in Kubernetes Cluster
Create Grafana YAML File:

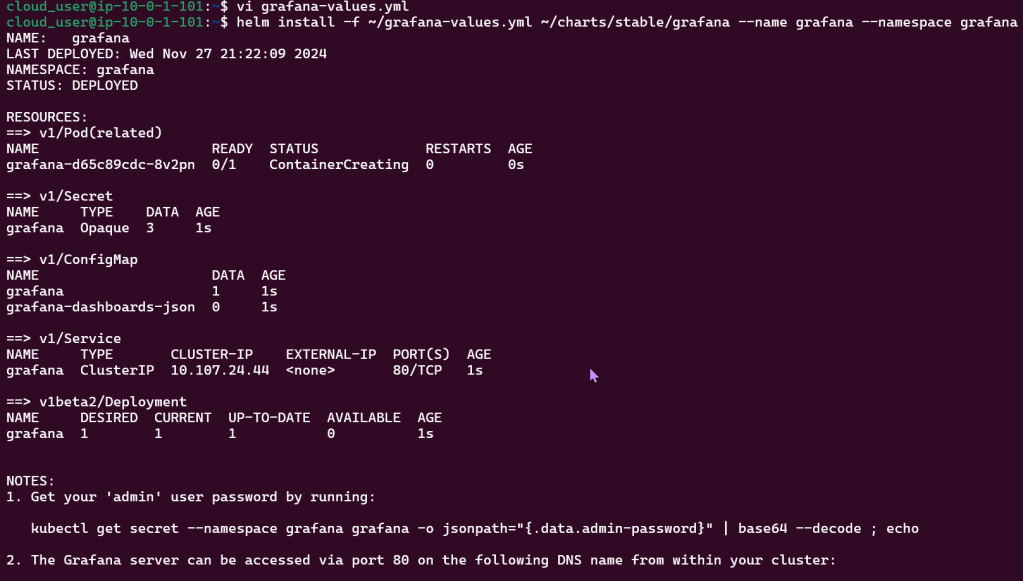
Install Grafana:
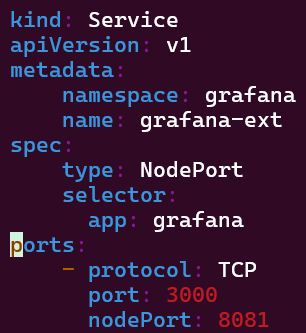
Create Grafana-Extension YAML File:
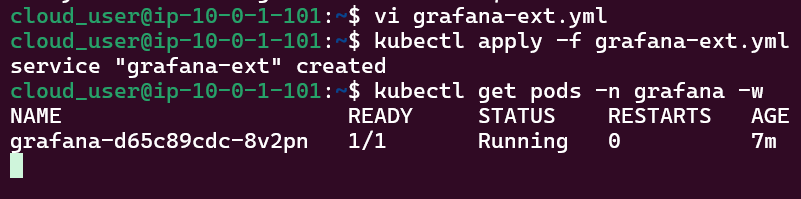
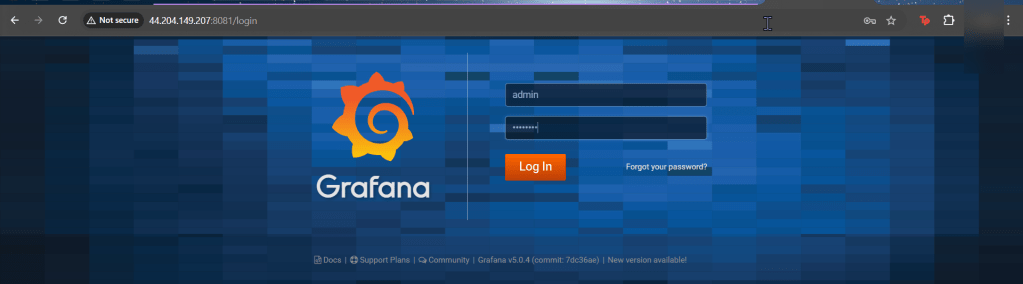
Log-in to Grafana: