
Goal:
Context:
Lets show how you can help a team migrate their infrastructure to Docker containers..
Part 1 Activities:
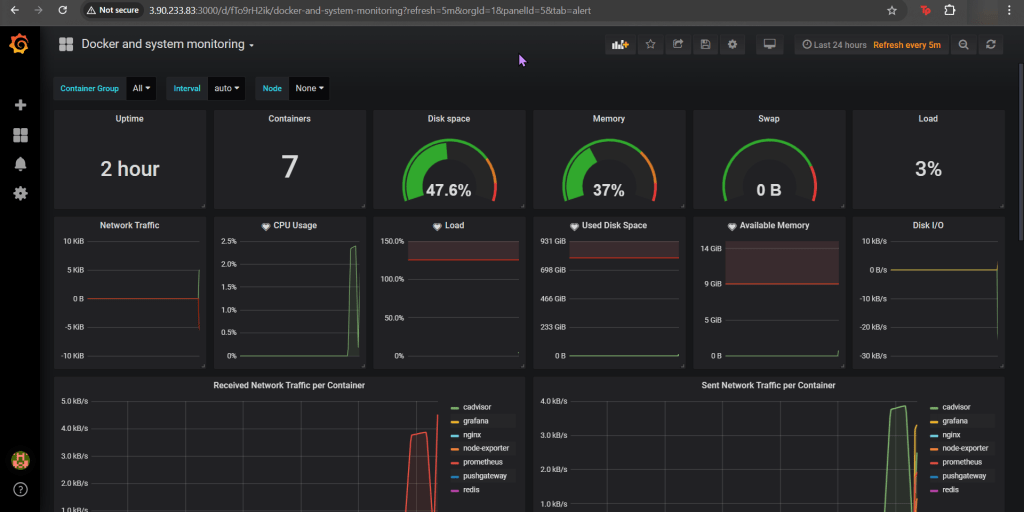
See how to utilize Prometheus to monitor your toys (containers). Then you can use the gangster tool of Grafana to visualize & alert!
Lessons Learned:
- Pre-Req
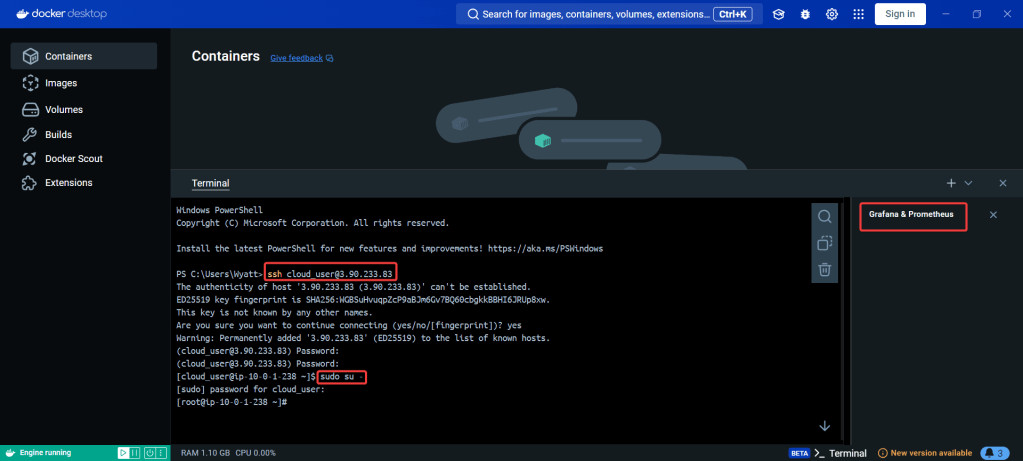
- SSH & Eleevate to Sudo su – !!
- Configure Docker
- Open Port
- Create daemon.json file
- Restart docker
- Curl to test Docker
- Update the Prometheus YAML File
- Update the Docker-Compose YAML File
- docker-compose.yml
- Apply changes & rebuild
- Ensure stuff is runnin’!
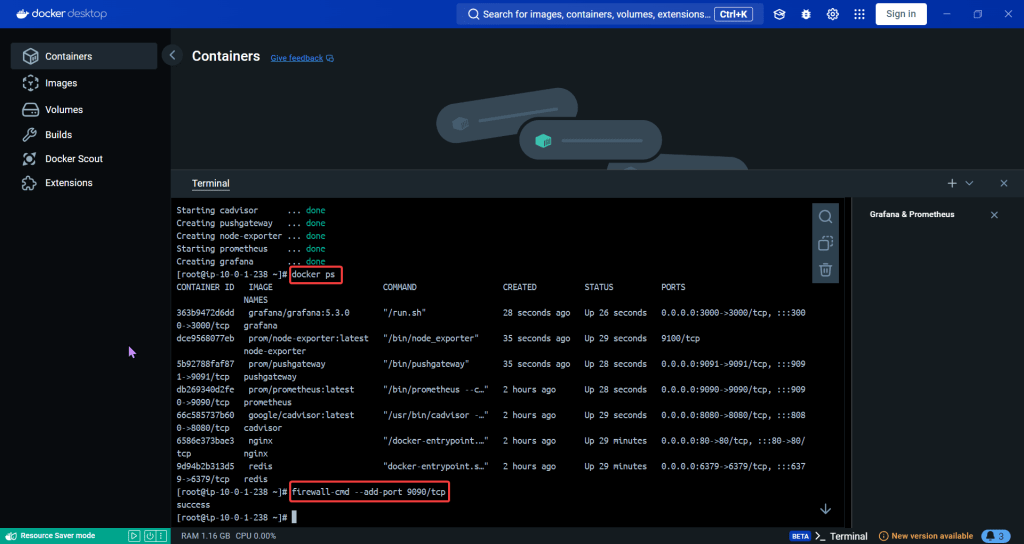
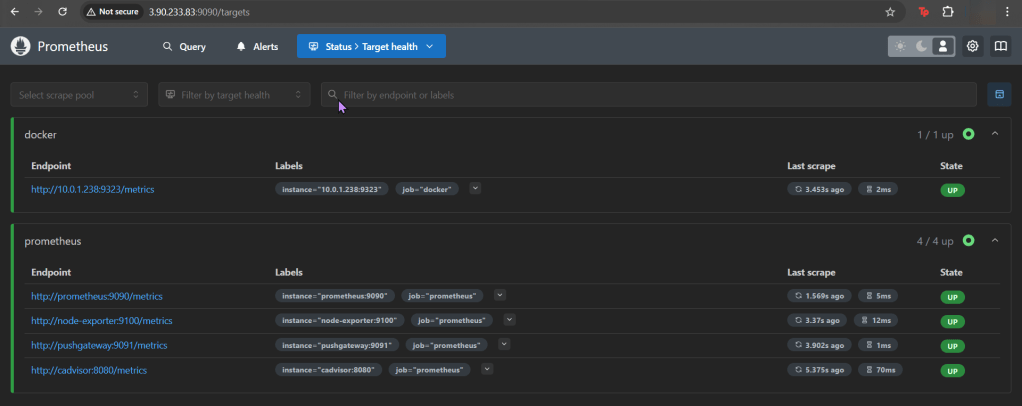
- Open port 9090
- Install the Docker & Monitoring DB
- Create Grafana Data Source
- Add Docker Dashboard
- Add email notification
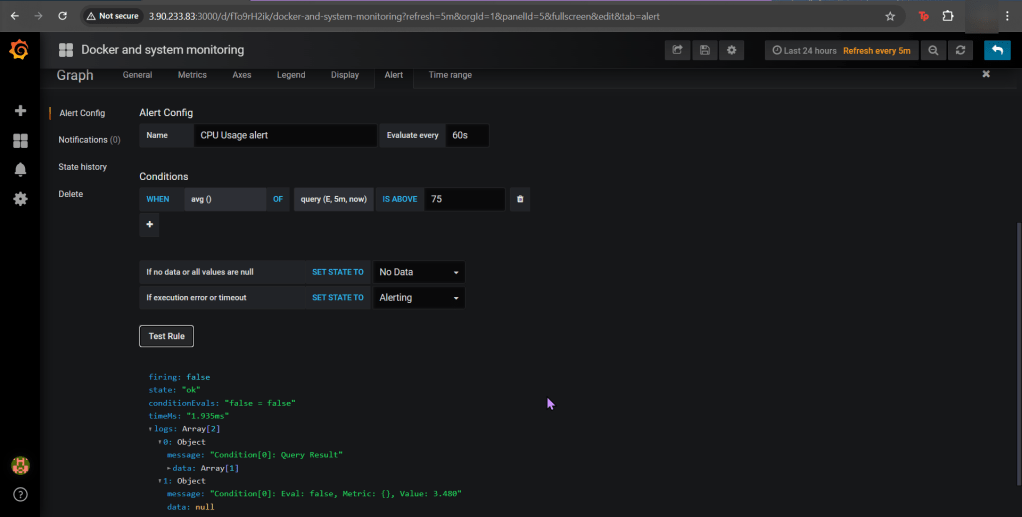
- Alert for CPU Usage
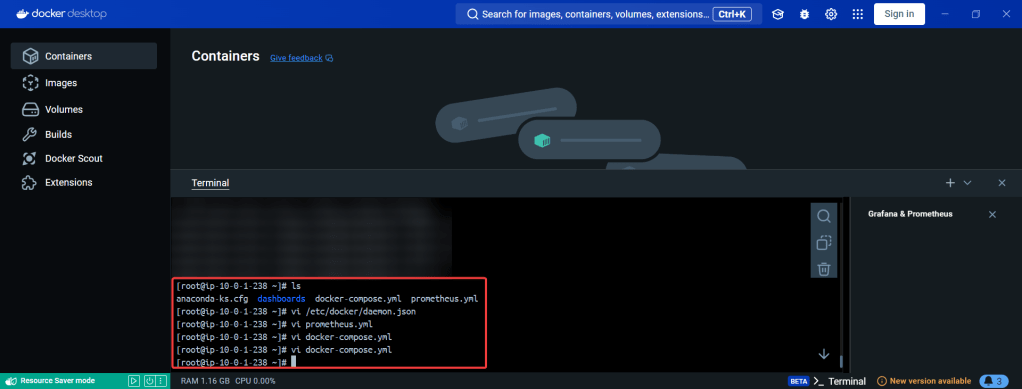
Pre-Req:
SSH & Elevate to Sudo su – !!:
Configure Docker:
Open Port (for FW in Docker reporting under Prometheus):
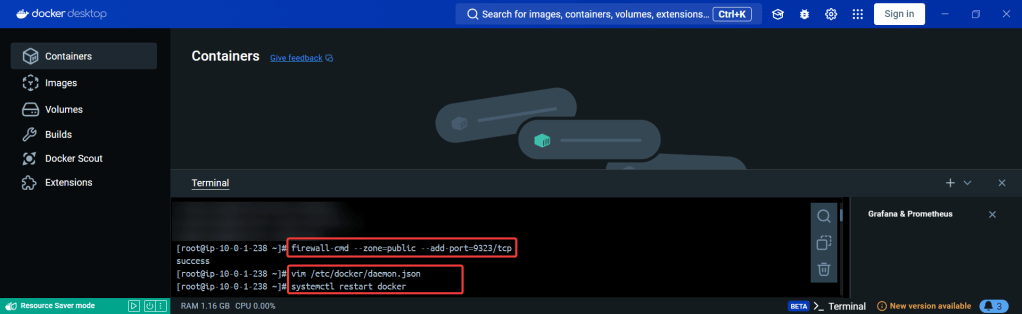
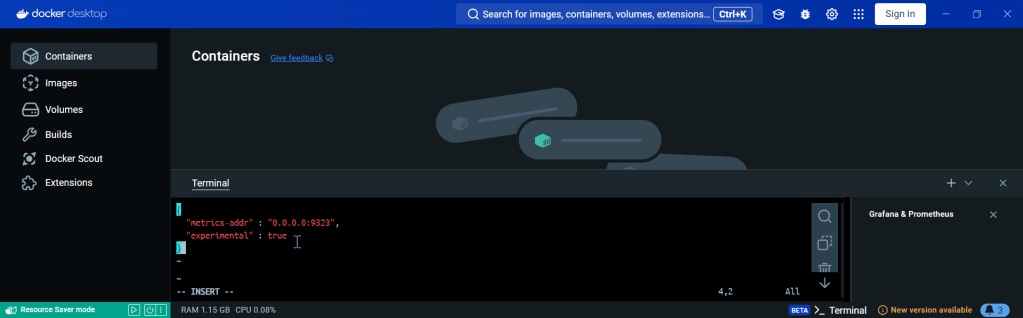
Create daemon.json file:
Restart Docker:
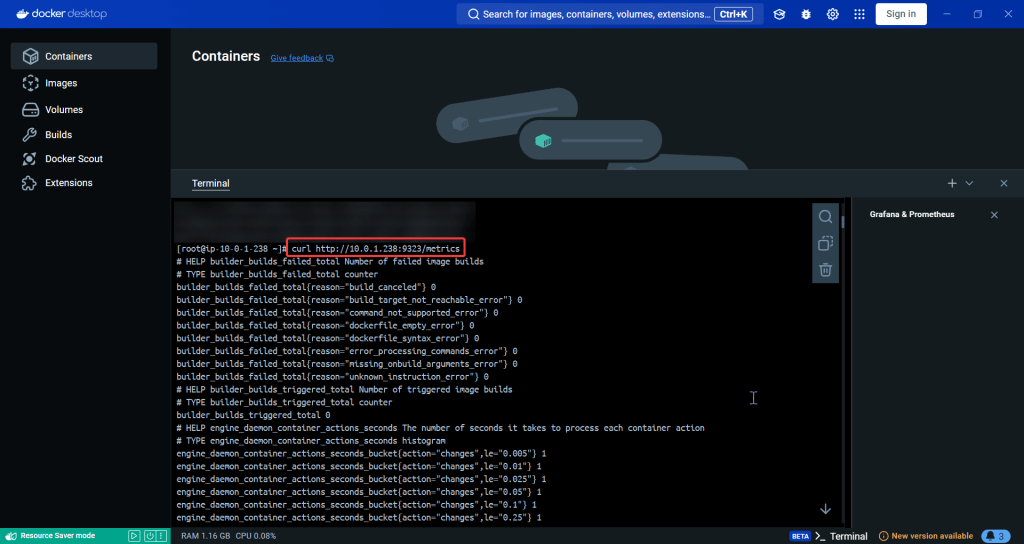
Curl to test Docker:
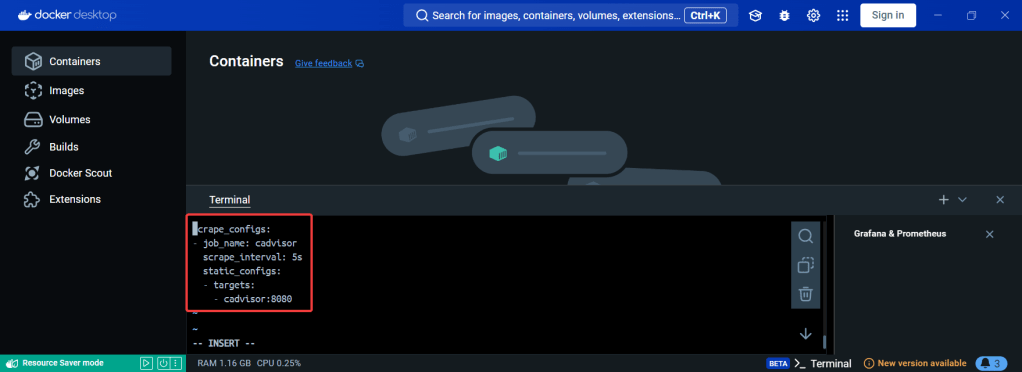
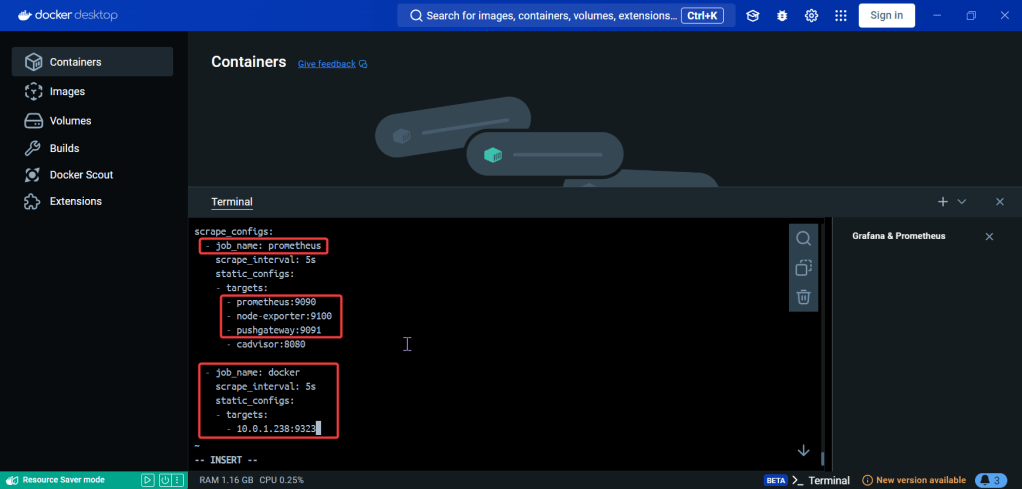
Update the Prometheus YAML File:
- Add gateway & Grafana to have visualization/reporting for Docker metrics
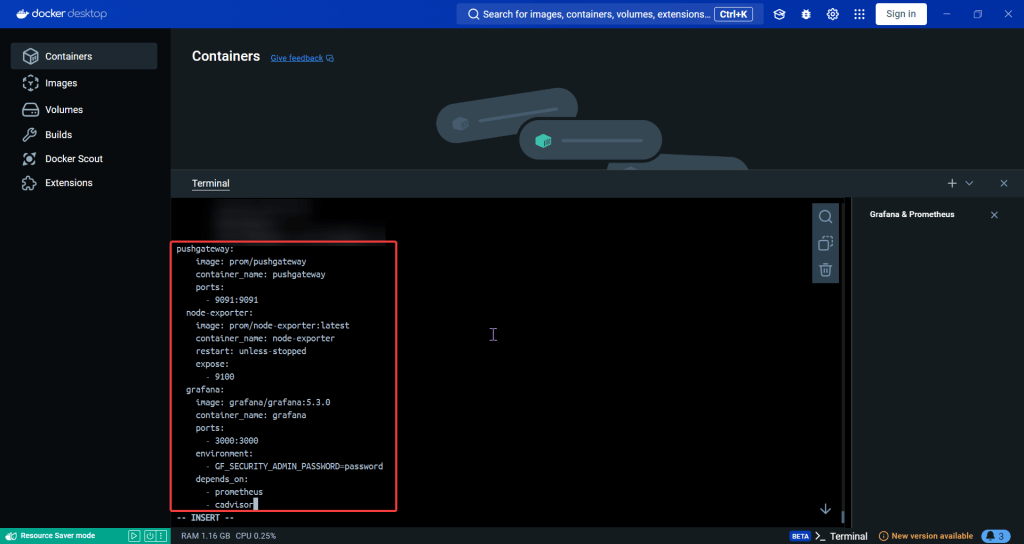
Update the Docker-Compose YAML File:
docker-compose.yml:

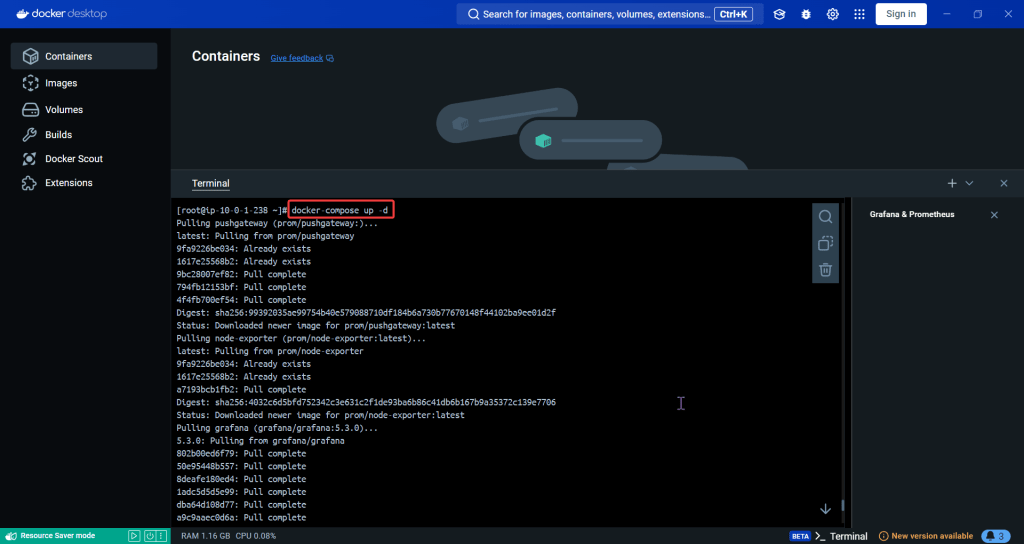
Apply changes & rebuild (docker-compose up -d):
Ensure stuff is runnin (docker ps) & Open port 9090:
Install the Docker & Monitoring DB:
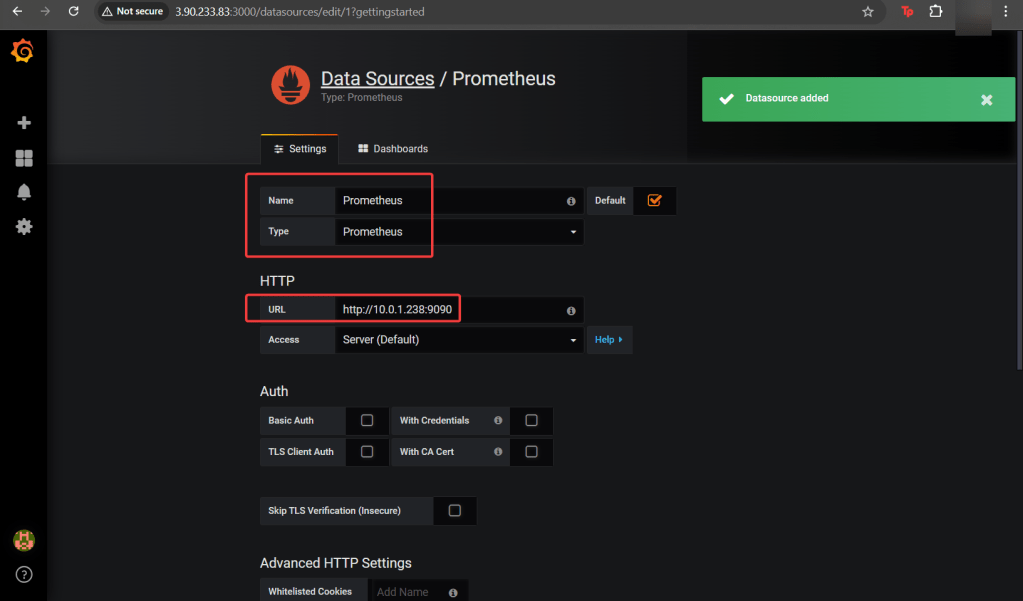
Create Grafana Data Source:
Add Docker Dashboard:

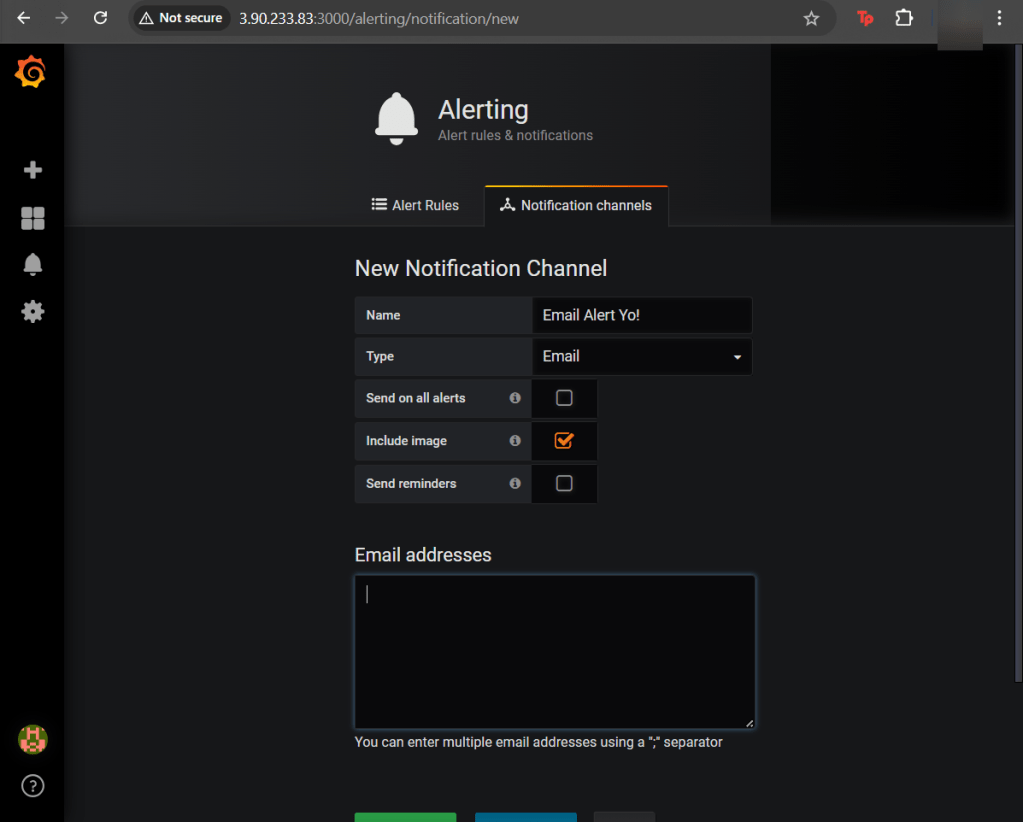
Add email notification:
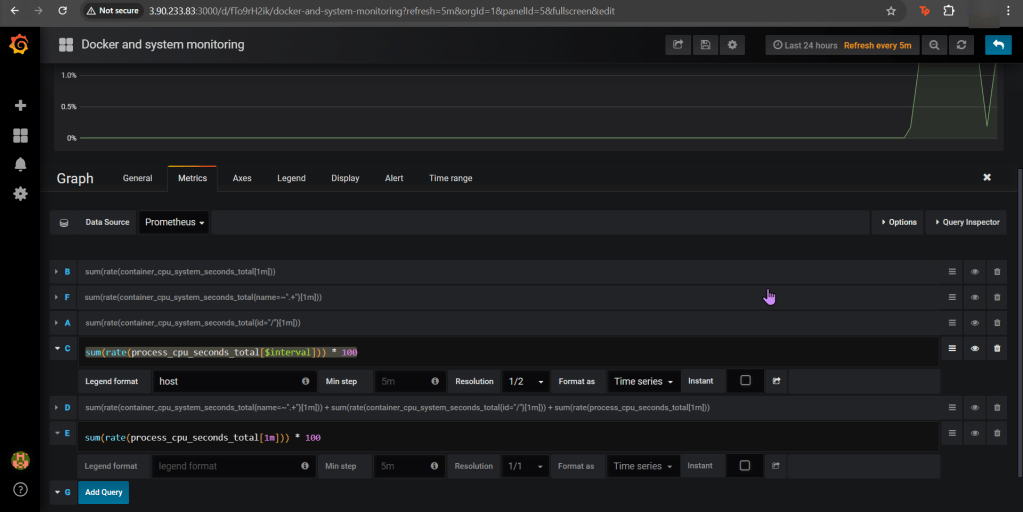
Alert for CPU Usage: