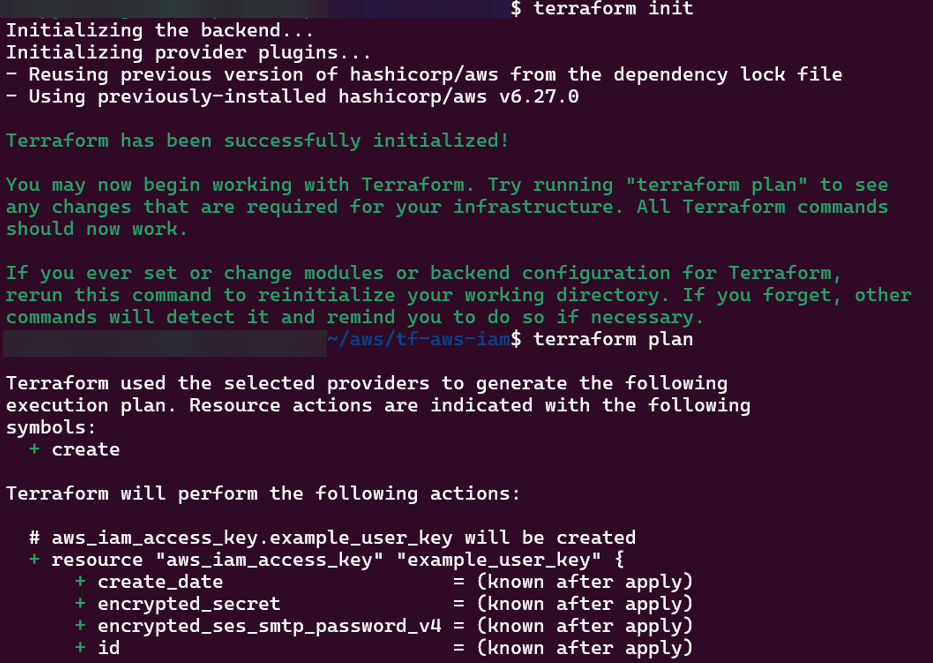
main.tf
provider "aws" {
  region = var.aws_region
}

# Create IAM user
resource "aws_iam_user" "example_user" {
  name = var.user_name
}

# Attach policy to the user
resource "aws_iam_user_policy_attachment" "example_user_policy" {
  user       = aws_iam_user.example_user.name
  policy_arn = var.policy_arn
}

# Create access keys for the user
resource "aws_iam_access_key" "example_user_key" {
  user = aws_iam_user.example_user.name
}
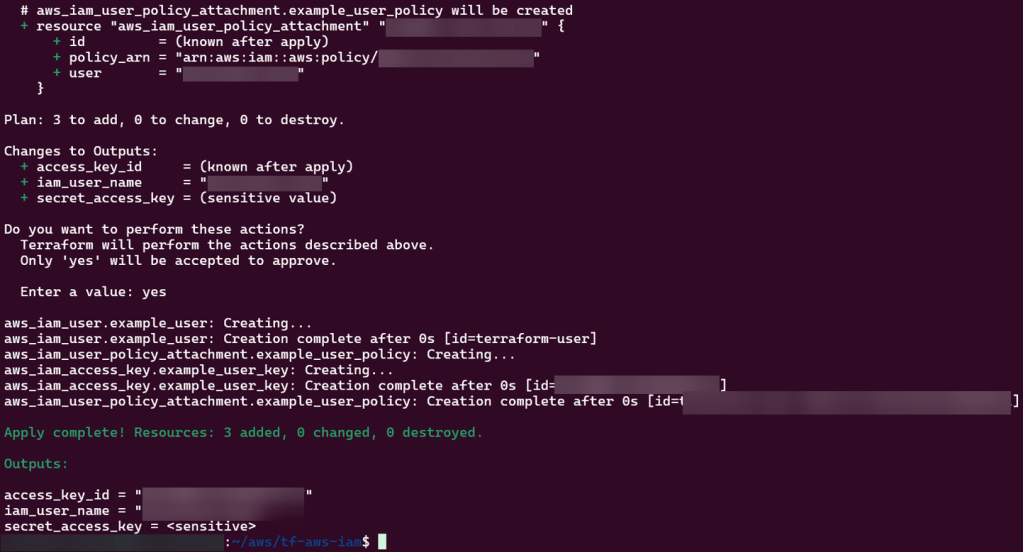
output.tf
output "iam_user_name" {
  value = aws_iam_user.example_user.name
}

output "access_key_id" {
  value = aws_iam_access_key.example_user_key.id
}

output "secret_access_key" {
  value     = aws_iam_access_key.example_user_key.secret
  sensitive = true
}
Set pods, deployments, etc w/the following commands
# kubectl get pods -n demo
# kubectl get pods -A
# kubectl get deployments -n demo
# kubectl get pods --all-namespaces
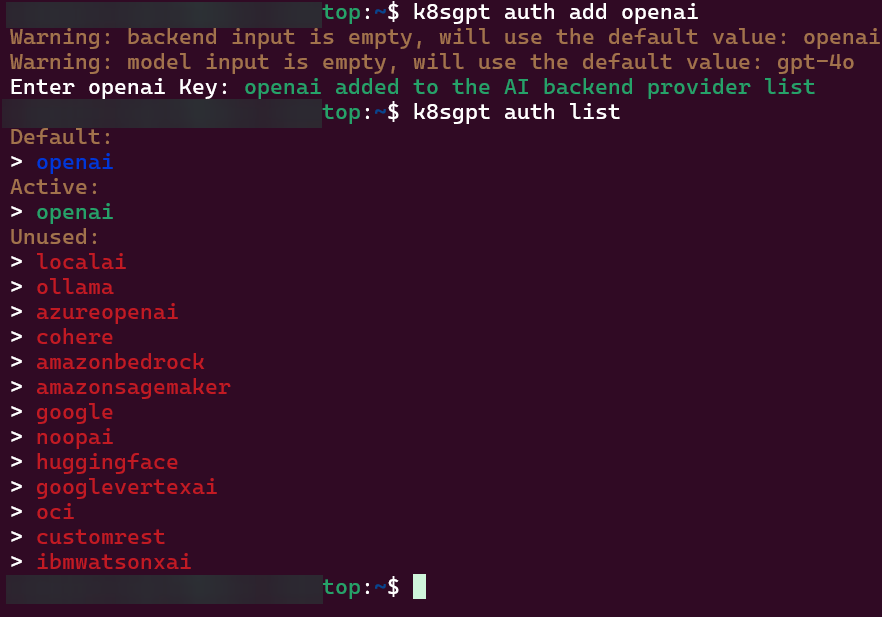
# k8sgpt integration list
# k8sgpt filters list
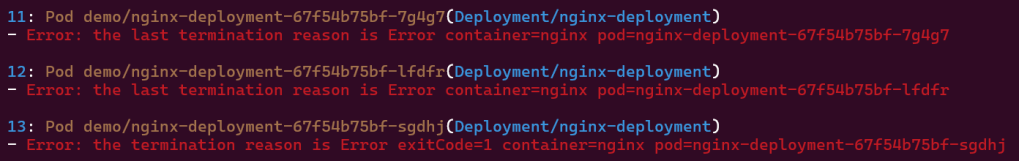
# k8sgpt analyse --filter=VulnerabilityReport
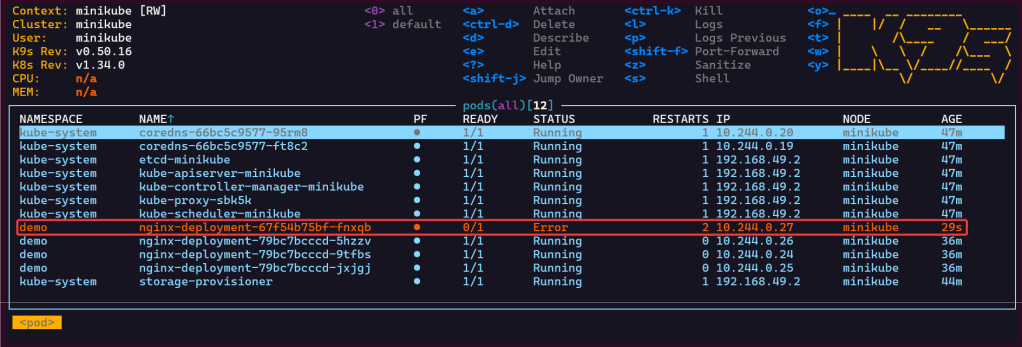
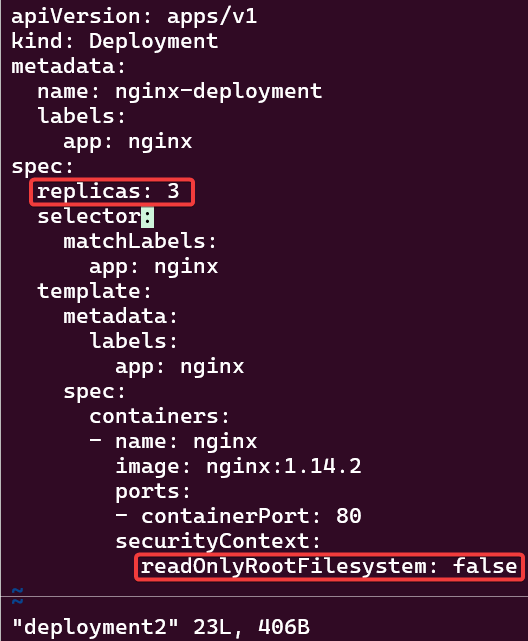
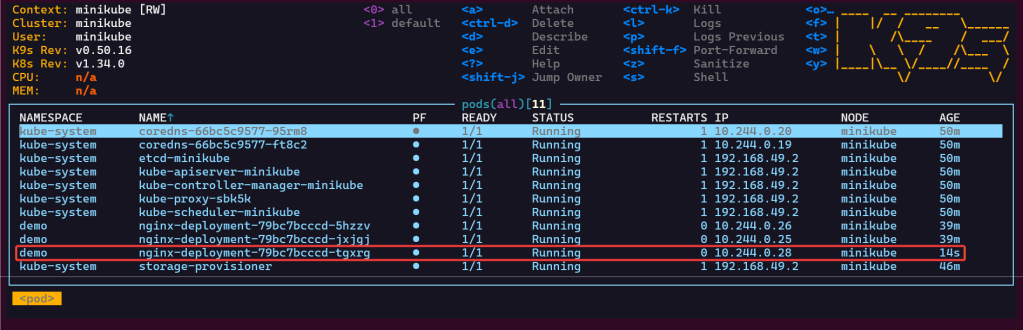
# vi deployment2
# kubectl apply -f deployment2 -n demo
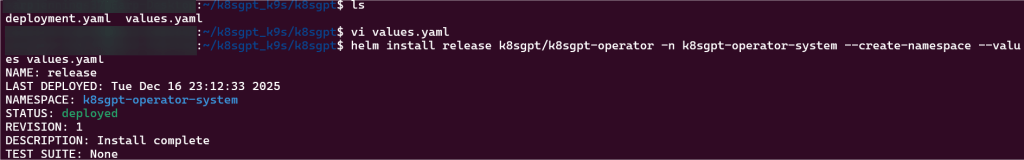
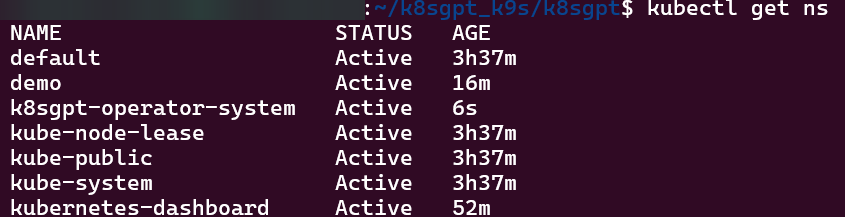
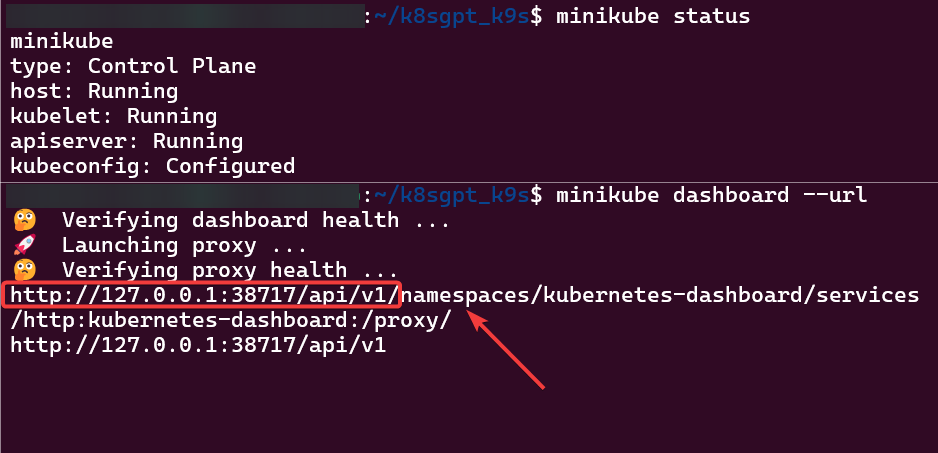
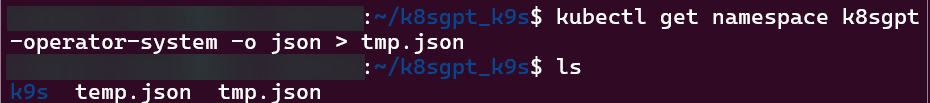
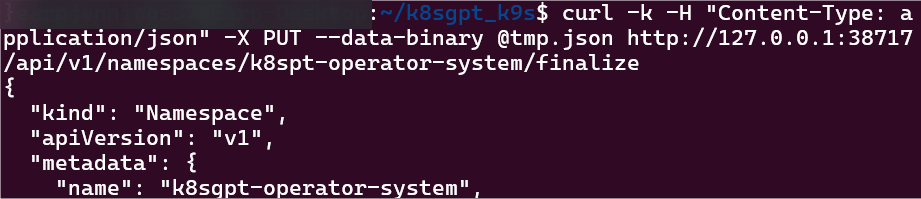
Commands to see if your new ns installed:
# kubectl get ns
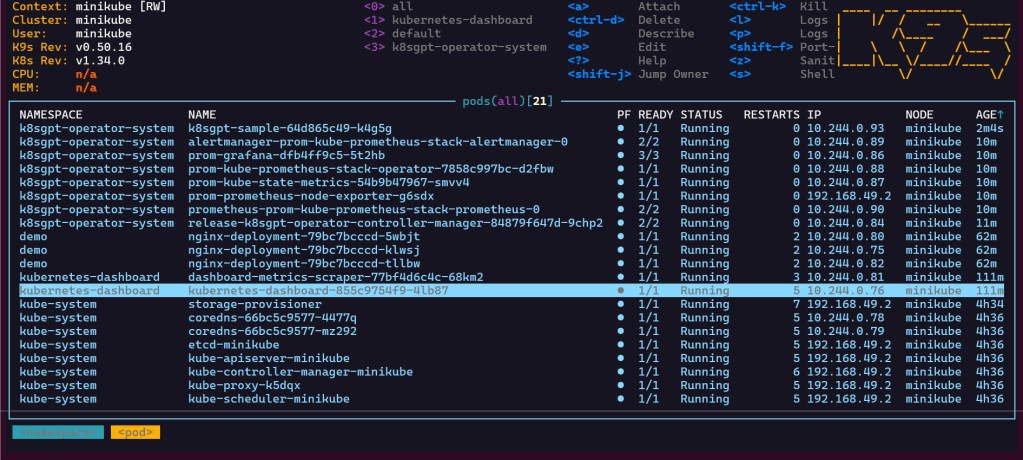
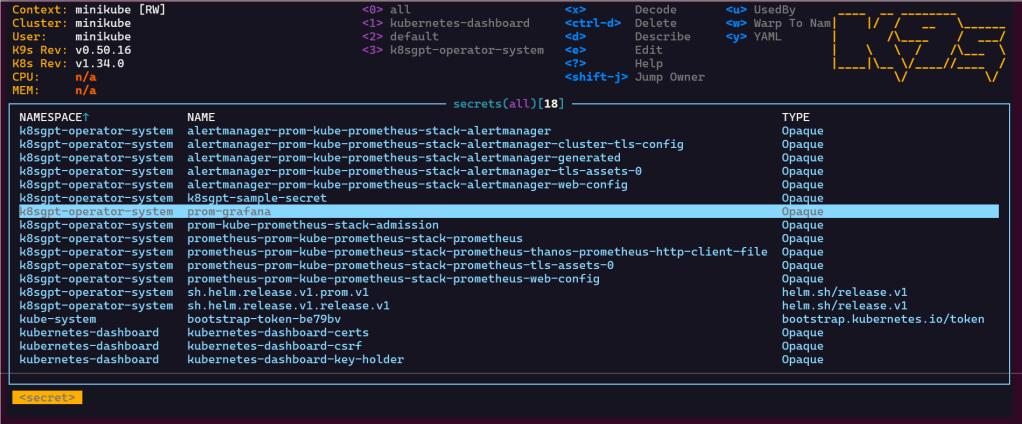
# kubectl get pods -n k8sgpt-operator-system
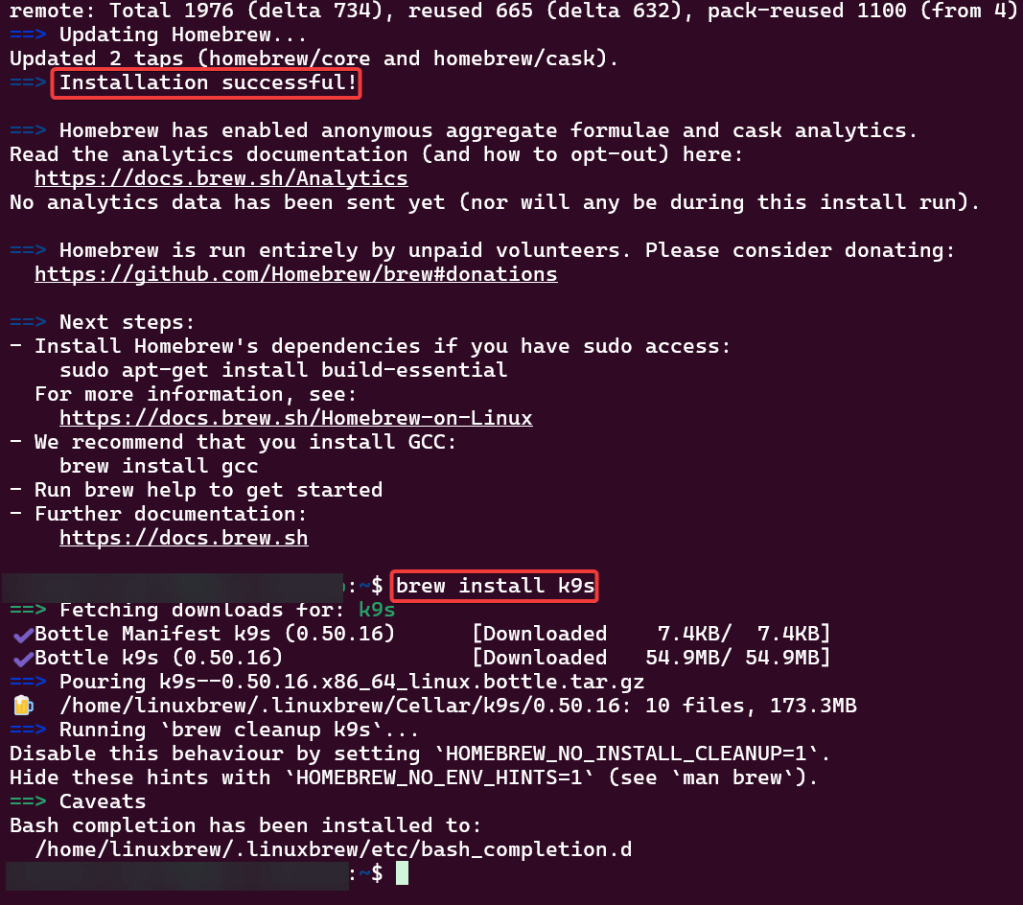
# k9s
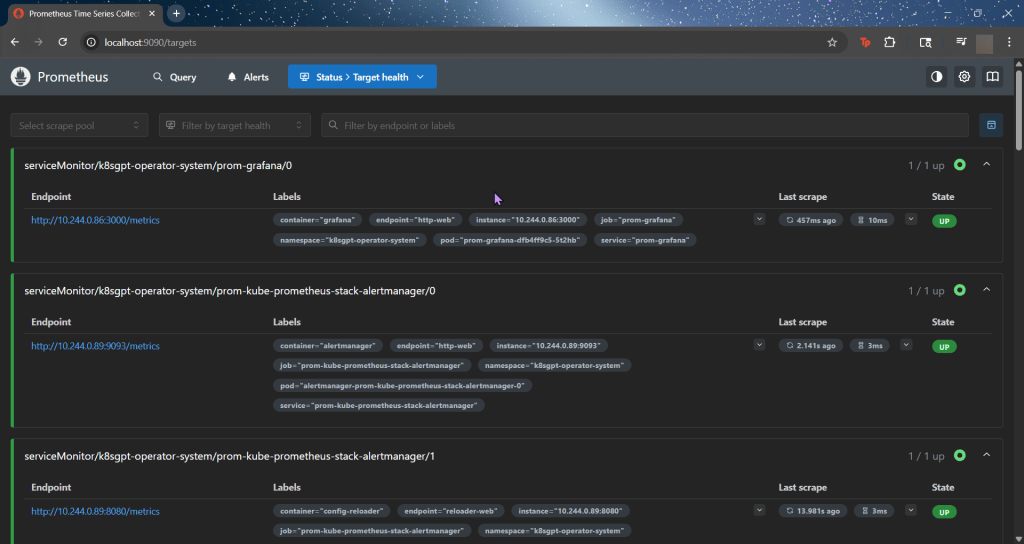
ServiceMonitor to send reports to Prometheus & create DB for K8sgpt:
# helm repo add prometheus-community https://prometheus-community.github.io/helm-charts
# kube-prometheus-stack has been installed. Check its status by running:
kubectl --namespace k8sgpt-operator-system get pods -l "release=prom"
Commands to squirrel away:- Get Grafana 'admin' user password by running:
# kubectl --namespace k8sgpt-operator-system get secrets prom-grafana -o jsonpath="{.data.admin-password}" | base64 -d ; echo
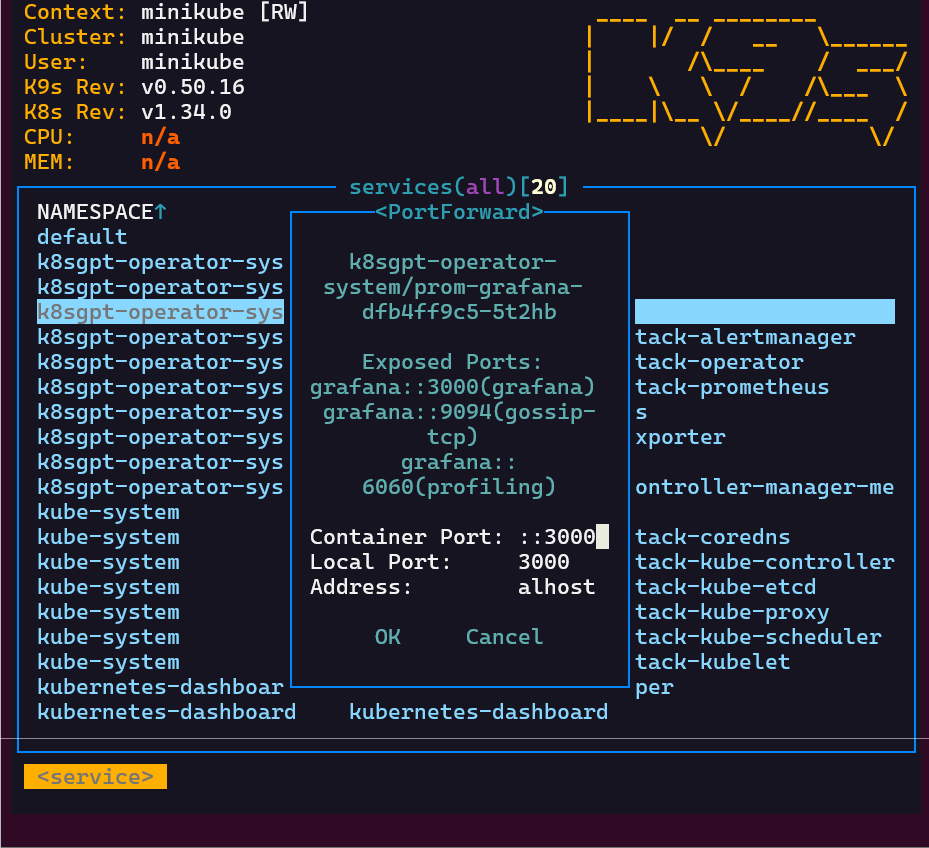
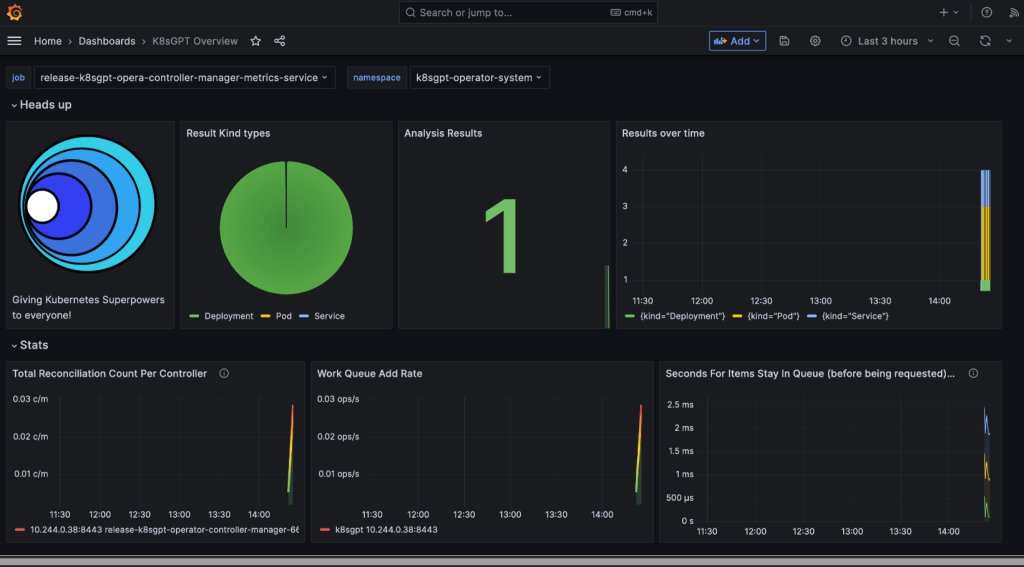
- Access Grafana local instance:
# export POD_NAME=$(kubectl --namespace k8sgpt-operator-system get pod -l "app.kubernetes.io/name=grafana,app.kubernetes.io/instance=prom" -oname)
kubectl --namespace k8sgpt-operator-system port-forward $POD_NAME 3000
- Get your grafana admin user password by running:
kubectl get secret --namespace k8sgpt-operator-system -l app.kubernetes.io/component=admin-secret -o jsonpath="{.items[0].data.admin-password}" | base64 --decode ; ech
Blog post includes covering K8s Automation, Telemetry, & Observability in preparation for the KCNA.
Helm Charts
Prometheus
Grafana
Probes & Kubelet
When Nodes Fail
Helm Charts: there magic simply put..conduct your standard linux practices & can navigate thru your helm chart install
# apt update && apt install -y git tree
# curl https://raw.githubusercontent.com/helm/helm/main/scripts/get-helm-3 | bash
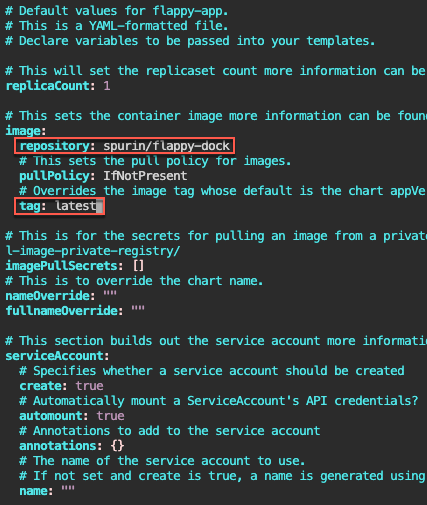
# cd flappy-app
# vim Chart.yaml
# vim values.yaml
# helm install flappy-app ./flappy-app-0.1.0.tgz
# export POD_NAME=$(kubectl get pods --namespace default -l "app.kubernetes.io/name=flappy-app,app.kubernetes.io/instance=flappy-app" -o jsonpath="{.items[0].metadata.name}"); export CONTAINER_PORT=$(kubectl get pod --namespace default $POD_NAME -o jsonpath="{.spec.containers[0].ports[0].containerPort}"); echo "Visit http://127.0.0.1:8080 to use your application"; kubectl --namespace default port-forward $POD_NAME 8080:$CONTAINER_PORT
# kubectl get deployment; echo; kubectl get pods; echo; kubectl get svc
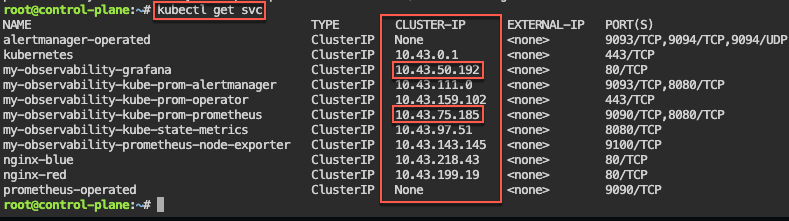
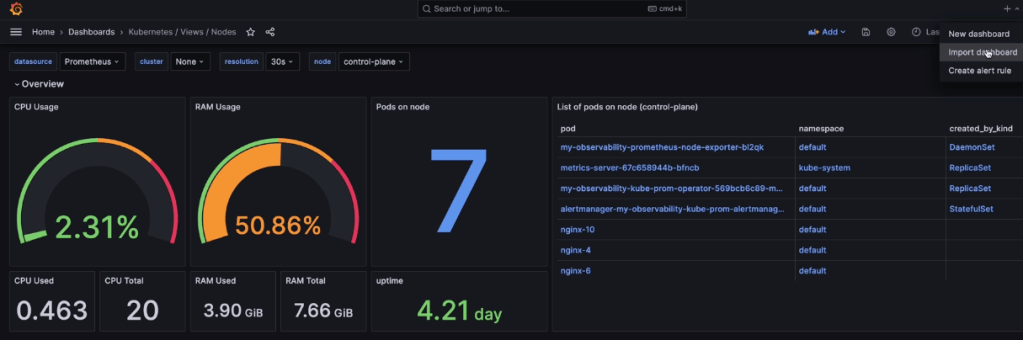
Prometheus & Grafana: 1st – add specific helm version for prometheus. 2nd – add nginx pod every 30 seconds. 3rd – then use cluster-ip to see the pods being added in prometheus & grafana.
# kubectl get all -A
# kubectl get svc
# for i in {1..10}; do kubectl run nginx-${i} --image=nginx; sleep 30; done
# helm uninstall my-observability
# kubectl -n kube-system delete service/my-observability-kube-prom-kubelet --now
When Nodes Fail:
Start as Healthy Nodes
Deployment
Stop kubelet & fail
Documentation informs us that we wait 5 minutes before posting as unknown & evicted
Grep to see pods moving from node to node
If a node stops reporting & taking pods… it becomes NotReady, existing workload continues if permitted, after 5 minutes the node controller evicts the pods onto healthy nodes, & can describe to see the status as unknown
Probes & The Kubelet:
Health Checks tell k8s what to do w/a container..
Liveness Probe
ARE YOU ALIVE!? if fails, kubelet restarts container
Readiness Probe
Ready for traffic? if fails, kubelet tells API to remove pod from svc endpt
Does NOT restart
Startup Probe
Kubelet checks if application is inside the container & started
If probe is running, liveness, & readiness checks are paused..once succeeds & probes take over
Blog post includes covering Kubernetes Deep Dive in preparation for the KCNA.
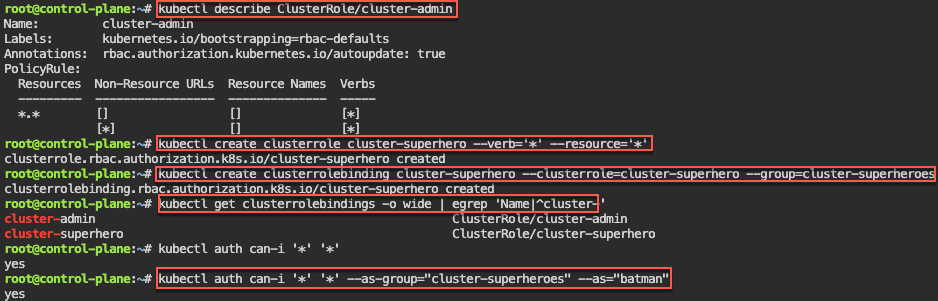
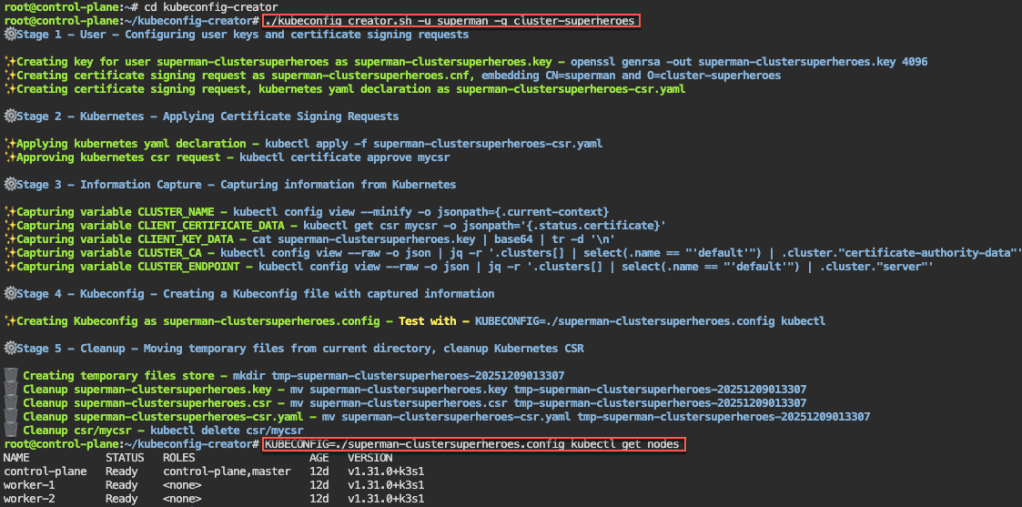
RBAC
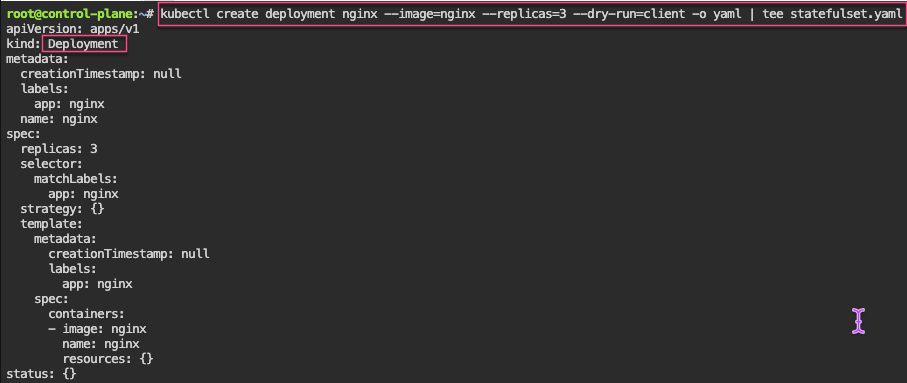
Stateful Sets
Security
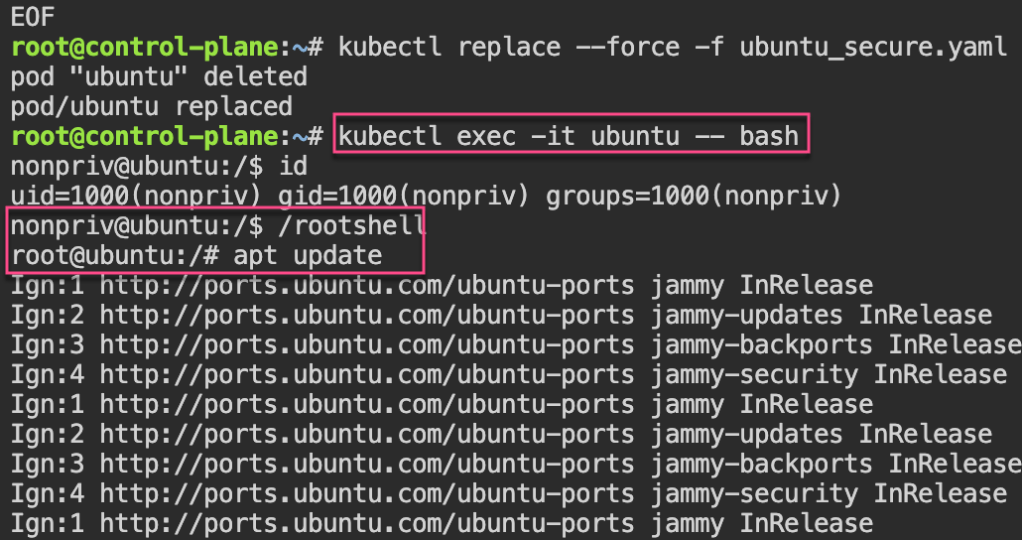
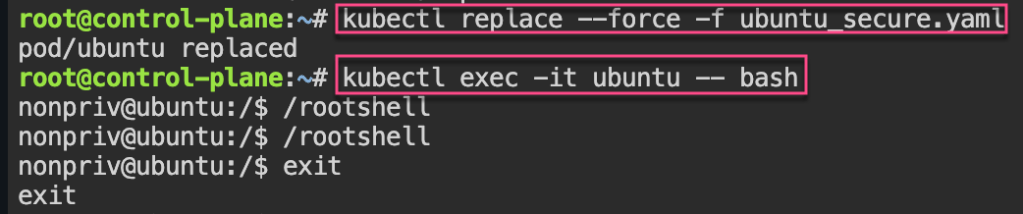
Security: 1st – create yaml file for ubuntu & can shell into root. 2nd – update spec for non-priv user & can escalate priv, 3rd – add spec to not allowed in escalating priv.
# kubectl patch statefulset/nginx -p '{"spec":{"updateStrategy":{"rollingUpdate":{"partition":2}}}}'
# kubectl set image statefulset/nginx nginx=nginx:alpine && kubectl rollout status statefulset/nginx
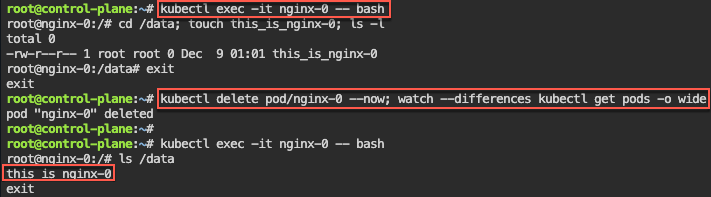
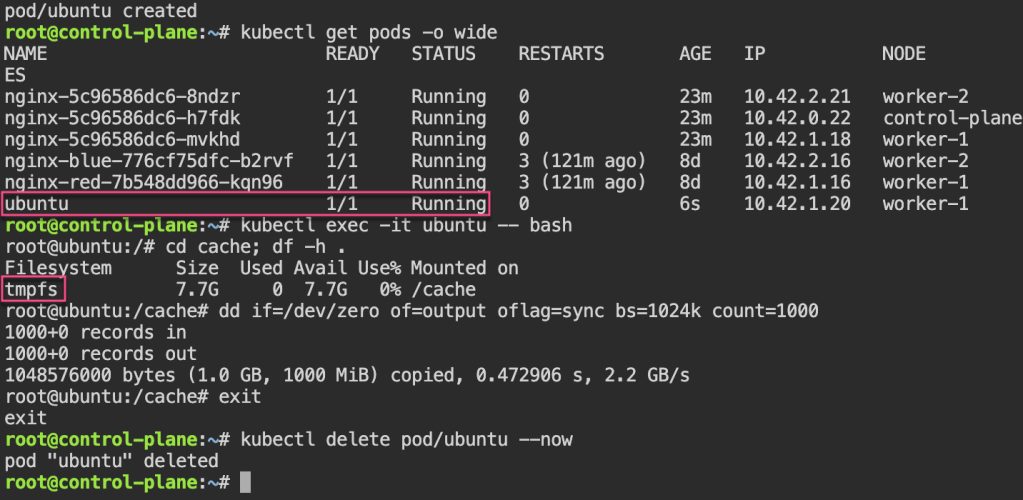
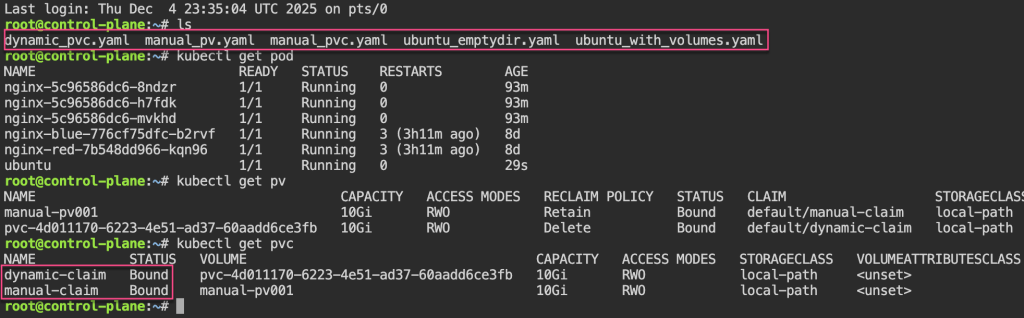
Persistent Storage: 1st – update yaml spec for volume mount. 2nd – shell into pod, create a note. 3rd – delete the pod & watch to spin back up, shell back into see the note.
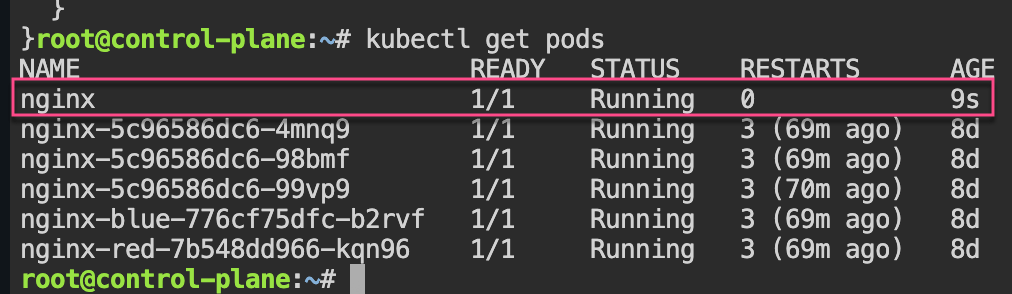
apt update && apt install -y git jq
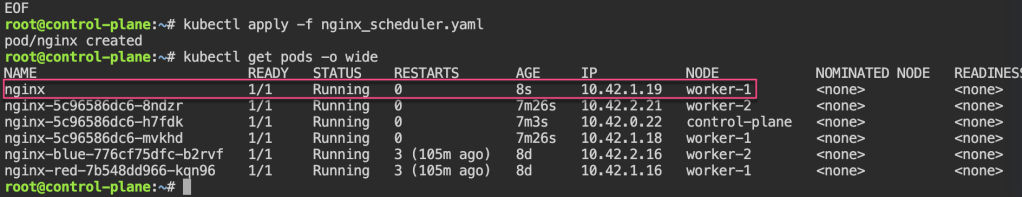
git clone https://github.com/spurin/simple-kubernetes-scheduler-example.git
cd simple-kubernetes-scheduler-example; more my-scheduler.sh
# ./my_scheduler.sh
🚀 Starting the custom scheduler...
🎯 Attempting to bind the pod nginx in namespace default to node worker-2
🎉 Successfully bound the pod nginx to node worker-2
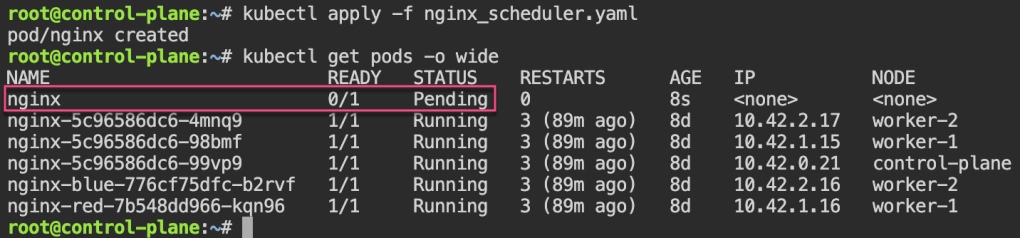
# kubectl get pods -o wide
NAME READY STATUS RESTARTS AGE IP NODE NOMINATED NODE READINESS GATES
nginx 1/1 Running 0 28s 10.42.2.3 worker-2 <none> <none>
Node Name: change spec to nodename specific area & notice variance of spec usage
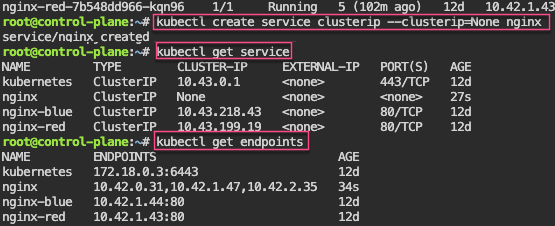
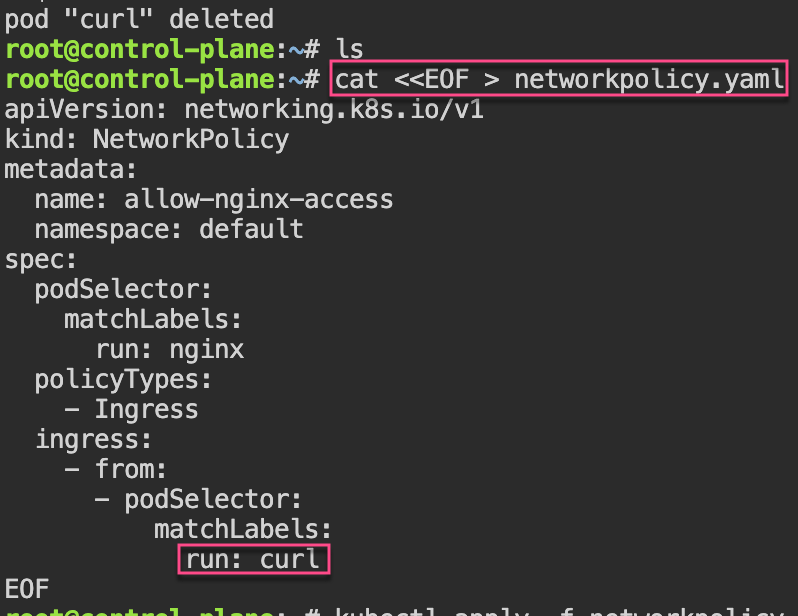
Network Policies: 1st – create pod, expose port, & curl to see access. 2nd – policy to restrict access w/label…cant access now..
# kubectl run nginx --image=nginx
# kubectl expose pod/nginx --port=80
# kubectl run --rm -i --tty curl --image=curlimages/curl:8.4.0 --restart=Never -- sh
# curl nginx.default.svc.cluster.local
If you don't see a command prompt, try pressing enter.
~ $ curl nginx.default.svc.cluster.local
<!DOCTYPE html>
<html>
<head>
<title>Welcome to nginx!</title>
<style>
html { color-scheme: light dark; }
body { width: 35em; margin: 0 auto;
font-family: Tahoma, Verdana, Arial, sans-serif; }
</style>
</head>
<body>
<h1>Welcome to nginx!</h1>
<p>If you see this page, the nginx web server is successfully installed and
working. Further configuration is required.</p>

<p>For online documentation and support please refer to
<a href="http://nginx.org/">nginx.org</a>.<br/>
Commercial support is available at
<a href="http://nginx.com/">nginx.com</a>.</p>

<p><em>Thank you for using nginx.</em></p>
</body>
</html>
~ $ exit
pod "curl" deleted
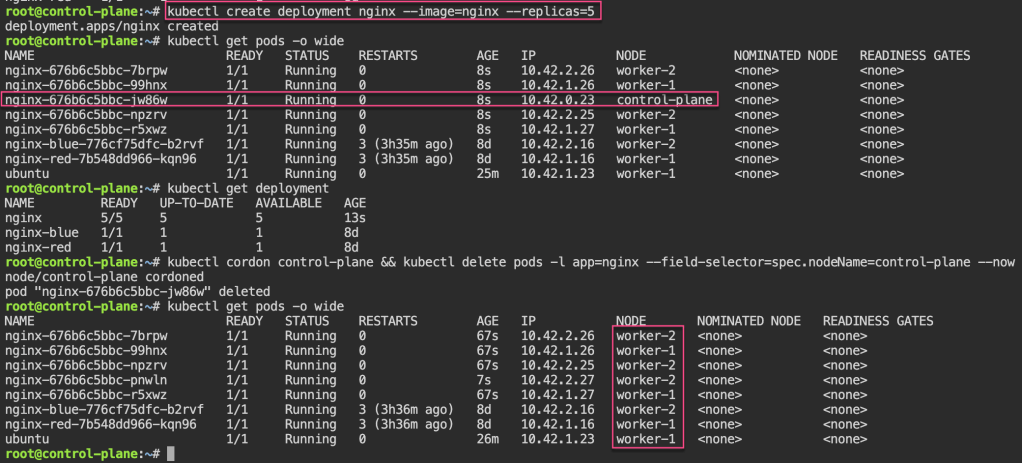
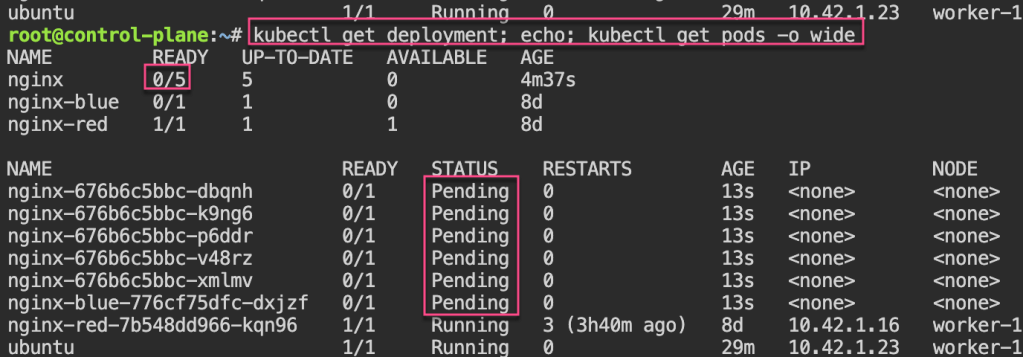
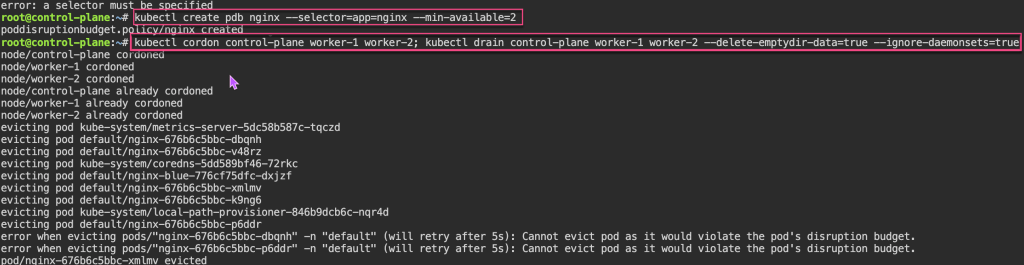
Pod Disruption Budgets: 1st – create replica-set deployment, & cordon node. 2nd – drain to now notice disruption cuz control-plane & worker-1 are “protected” & you all worker-2 nodes are empty. 3rd – uncordon. 4th – create PDB, & notice cant cordon or drain more than the PDB created.