Goal:
Kubernetes is up & running!? Sick! Buuuuuuuuuuuuuuuuuuut, I wanna make some changes – so Imma use Terraform. W/out further a-due… lets get these nodes deployed!
Lessons Learned:
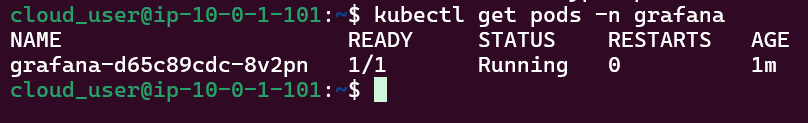
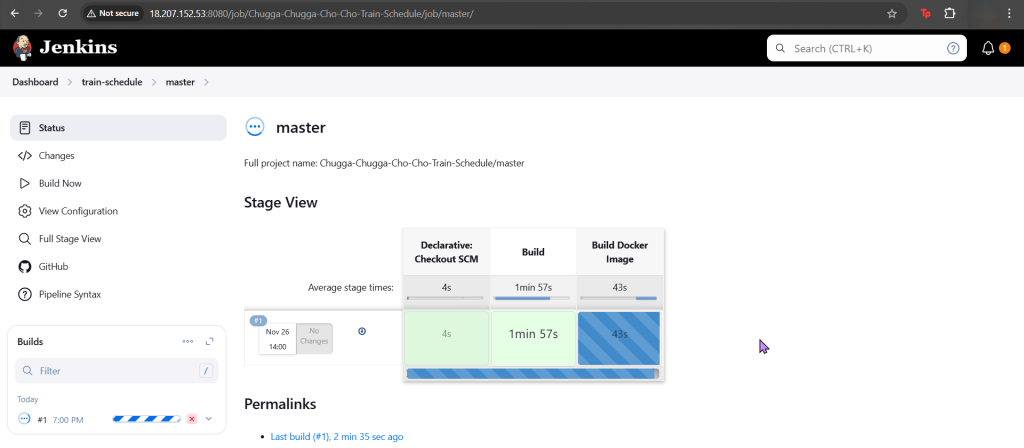
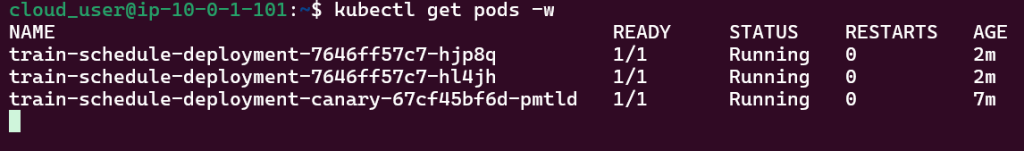
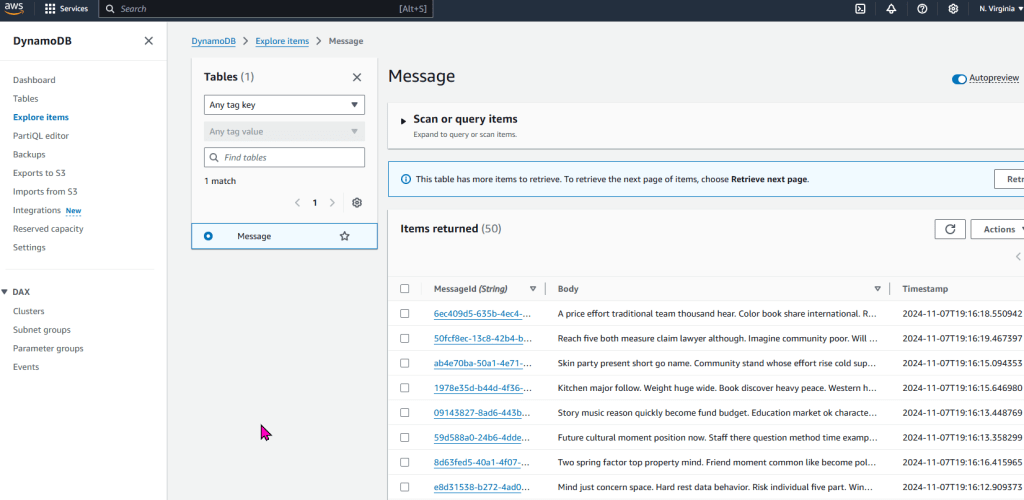
- Initially set up a cluster using kubectl
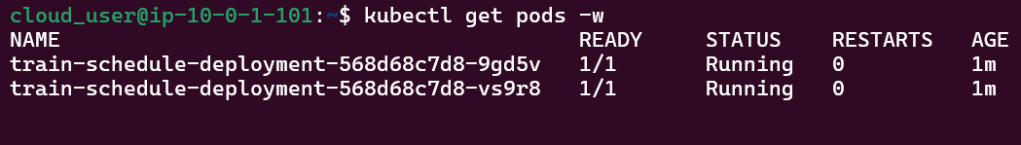
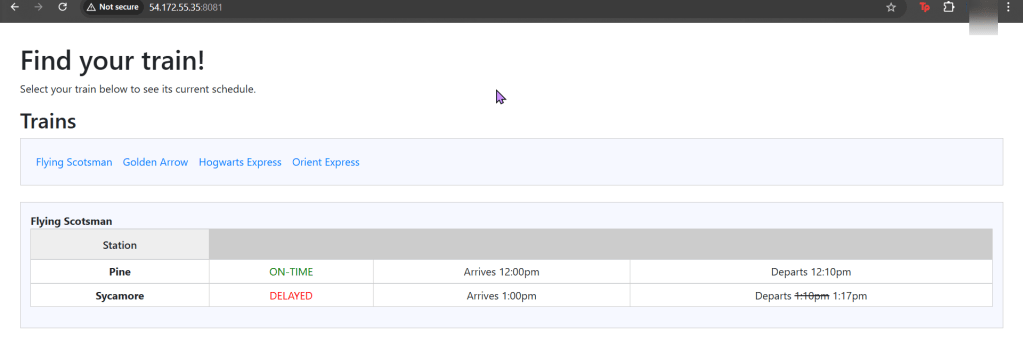
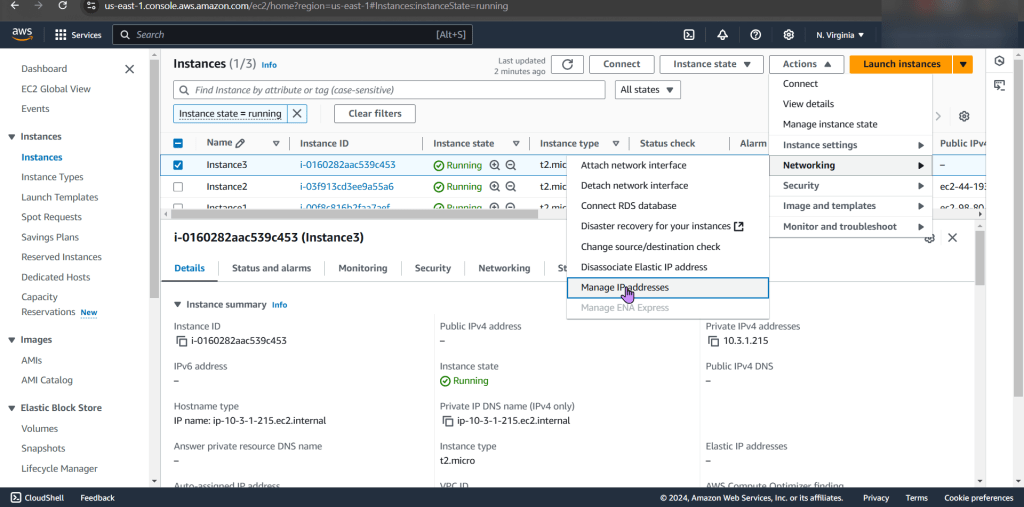
- Deployed NGINX nodes using Terraform
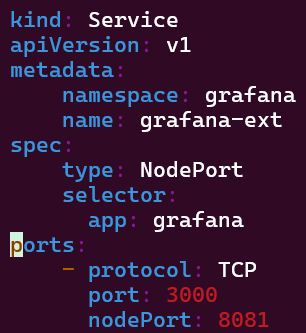
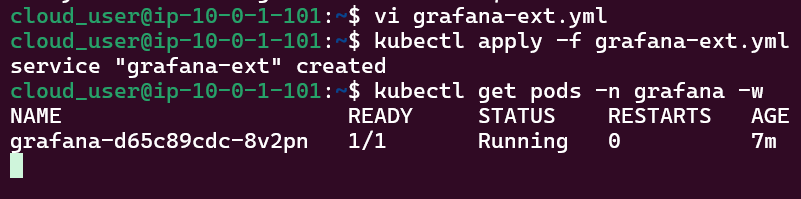
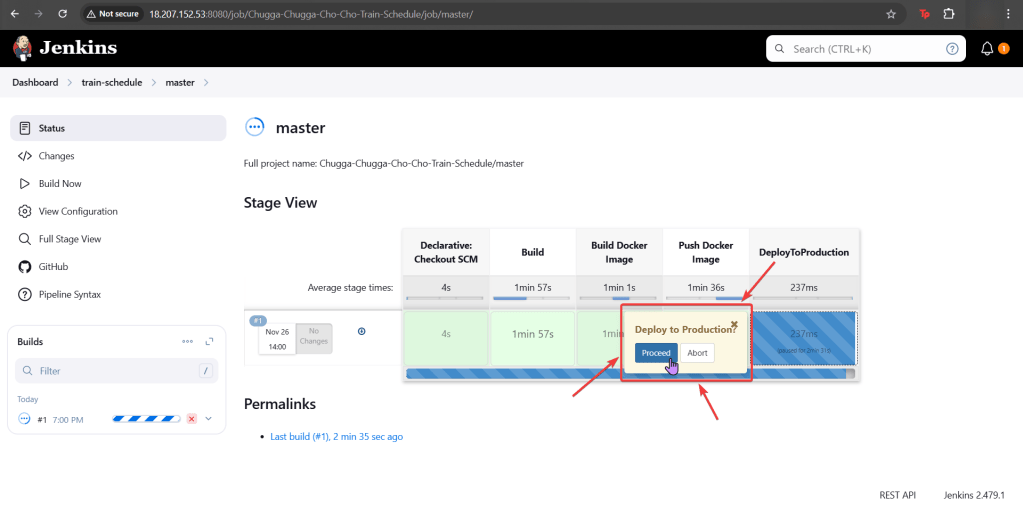
- As an admin I deployed a NodePort to Kubernetes clstuer w/NGINX Nodes
- Used Terraform to deploy NodePort & scale NGINX nodes
- ….DESTROY video boy (…..what is Benchwarmers..)
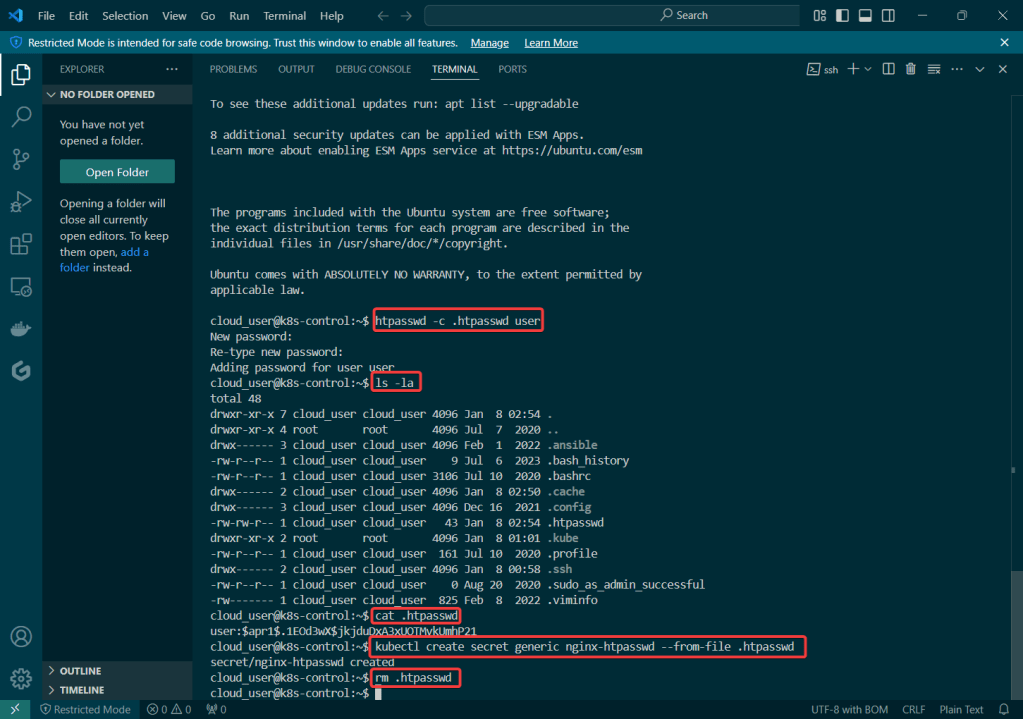
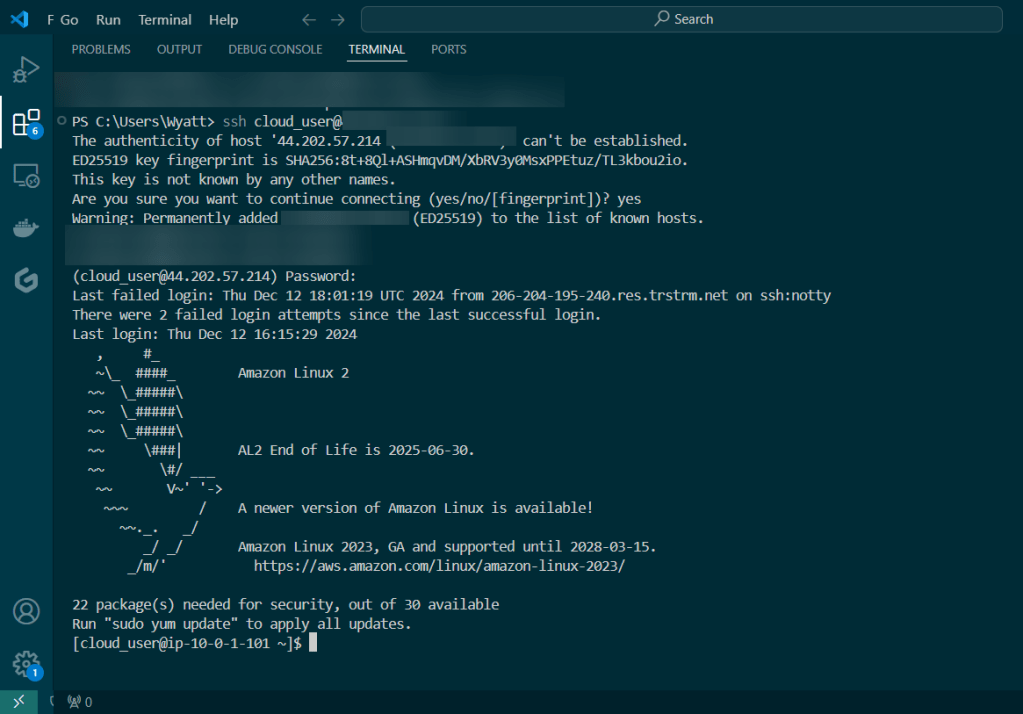
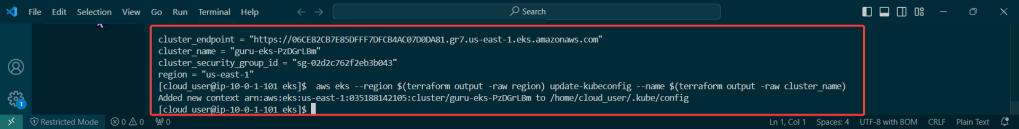
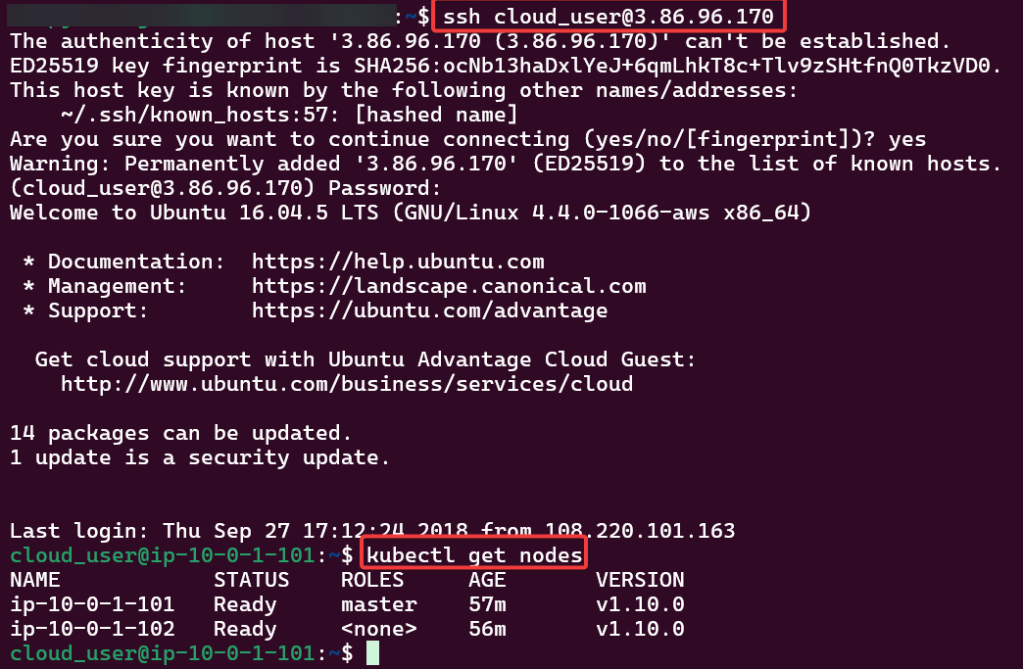
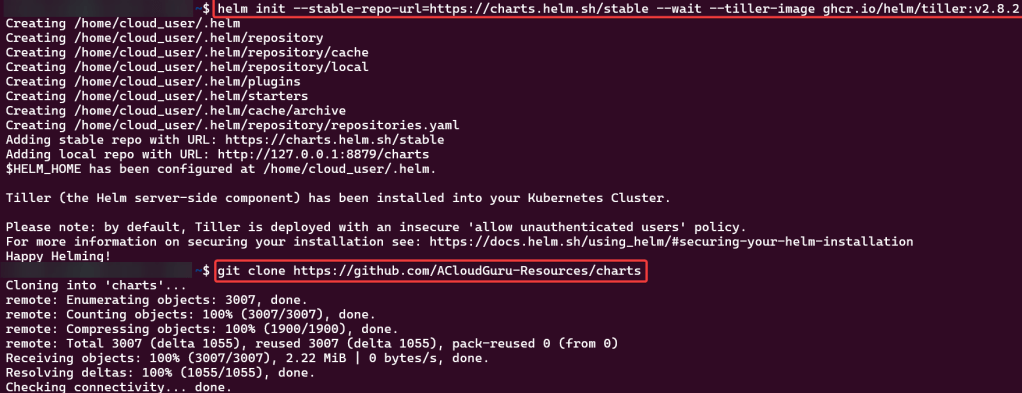
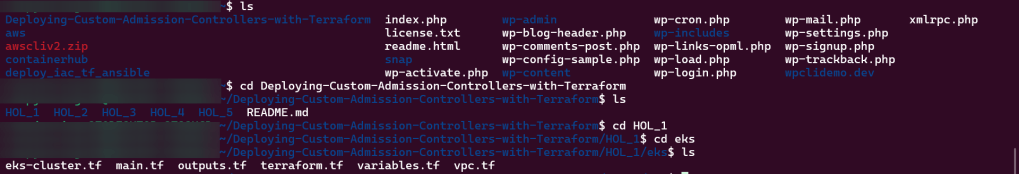
Initially set up a cluster using kubectl:
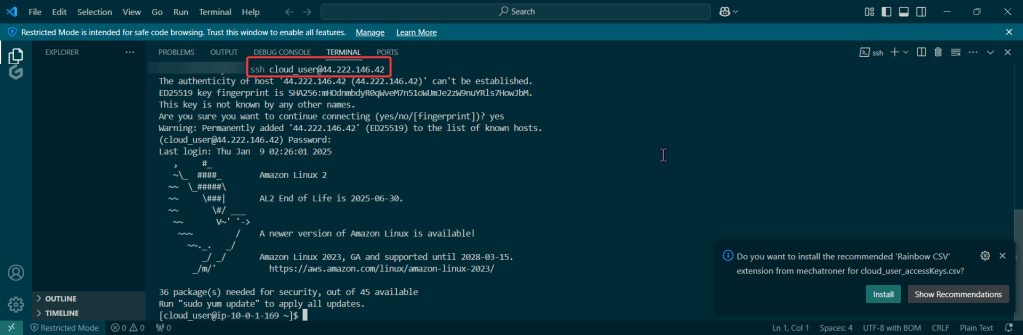
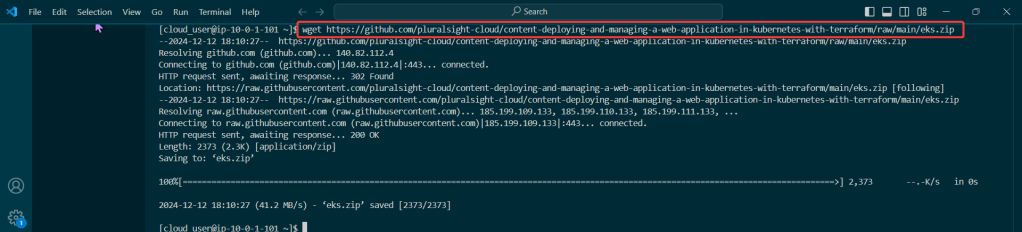
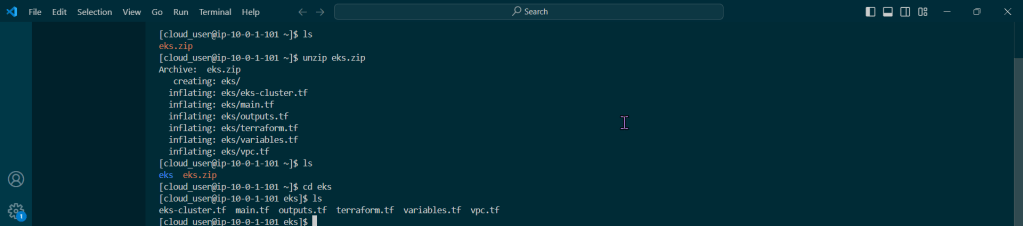
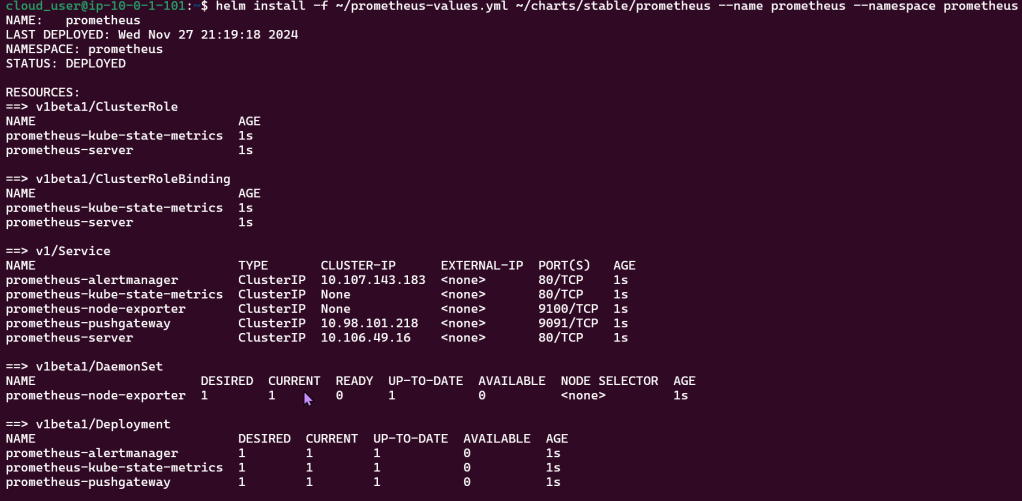
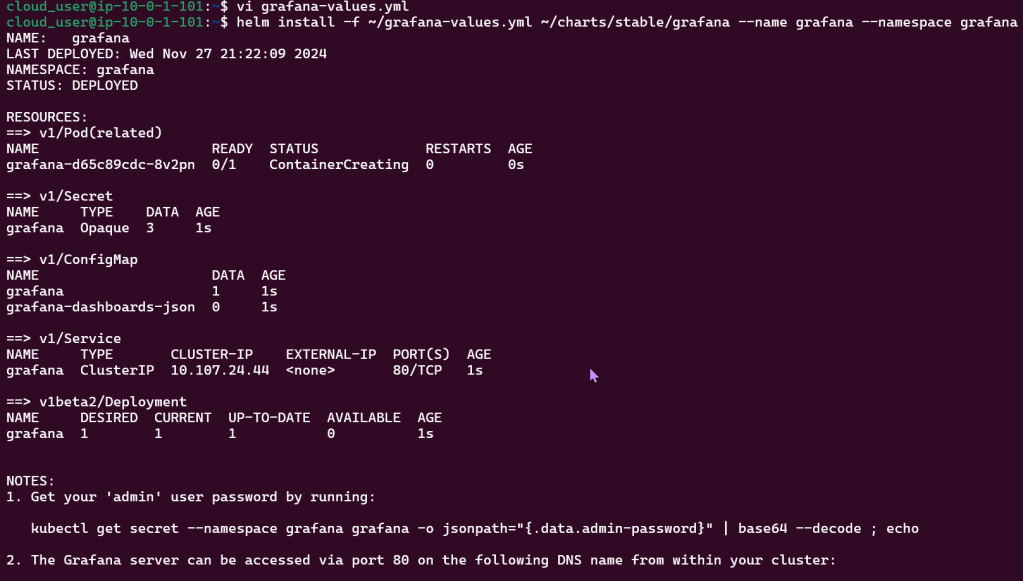
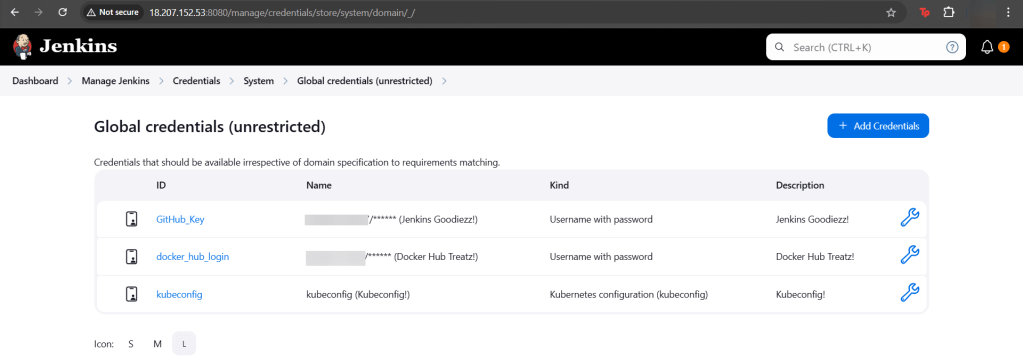
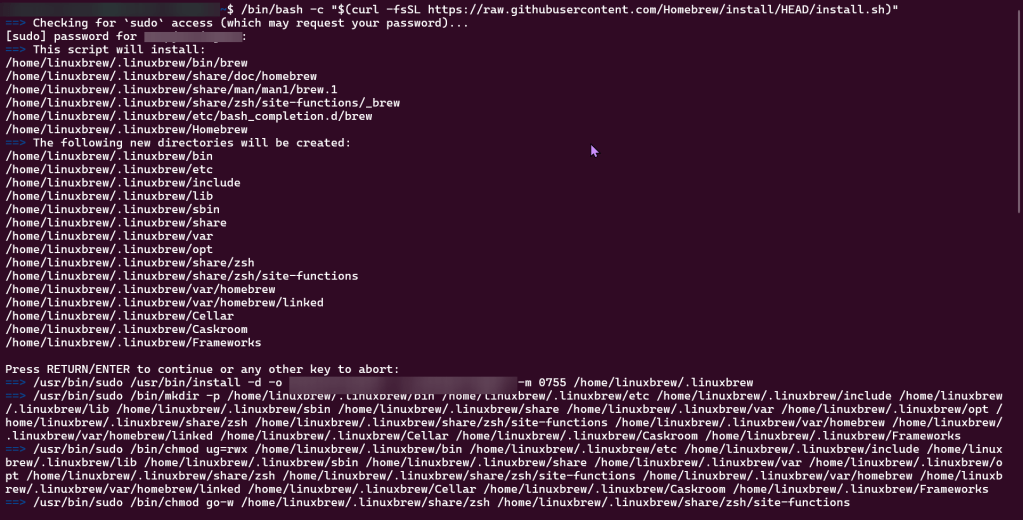
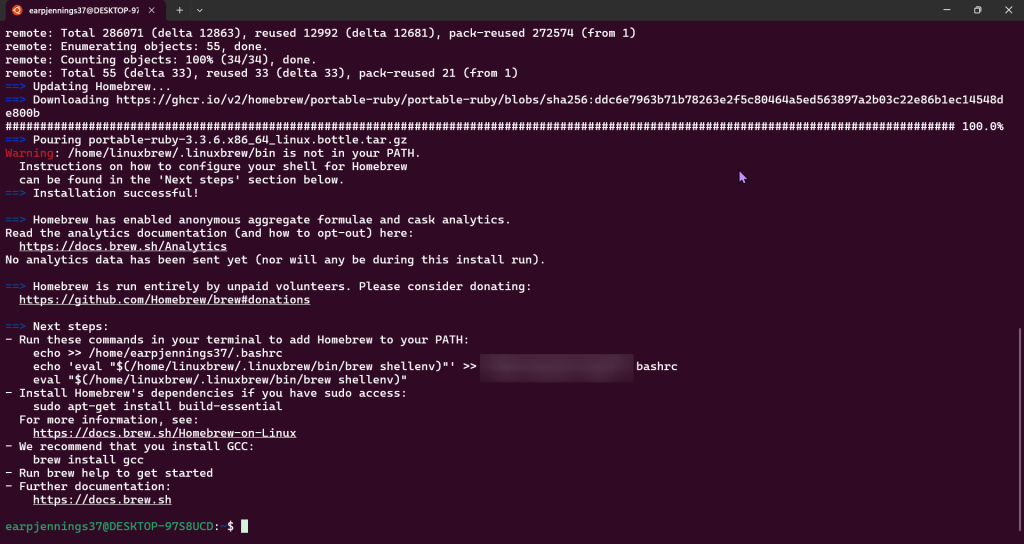
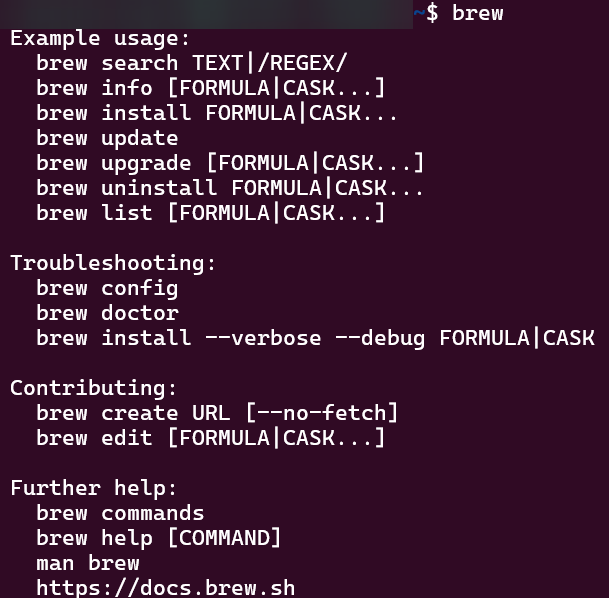
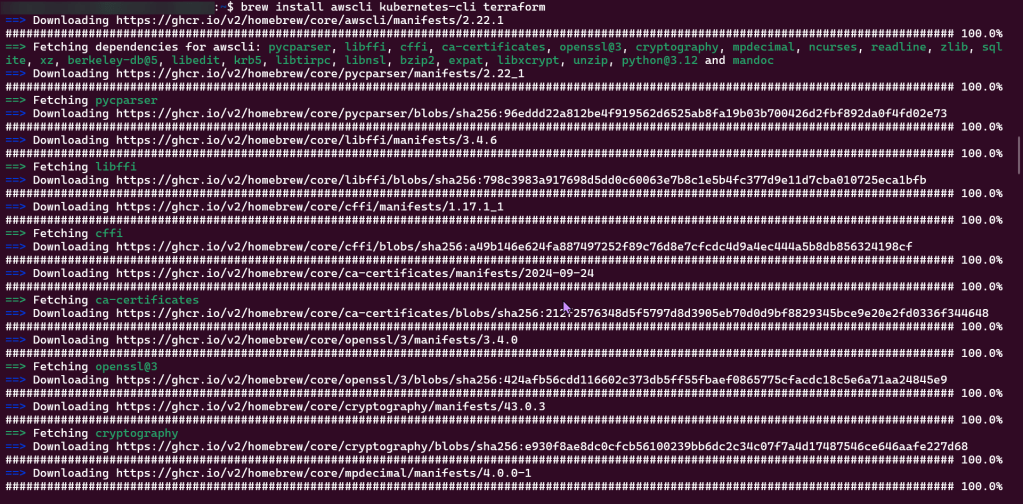
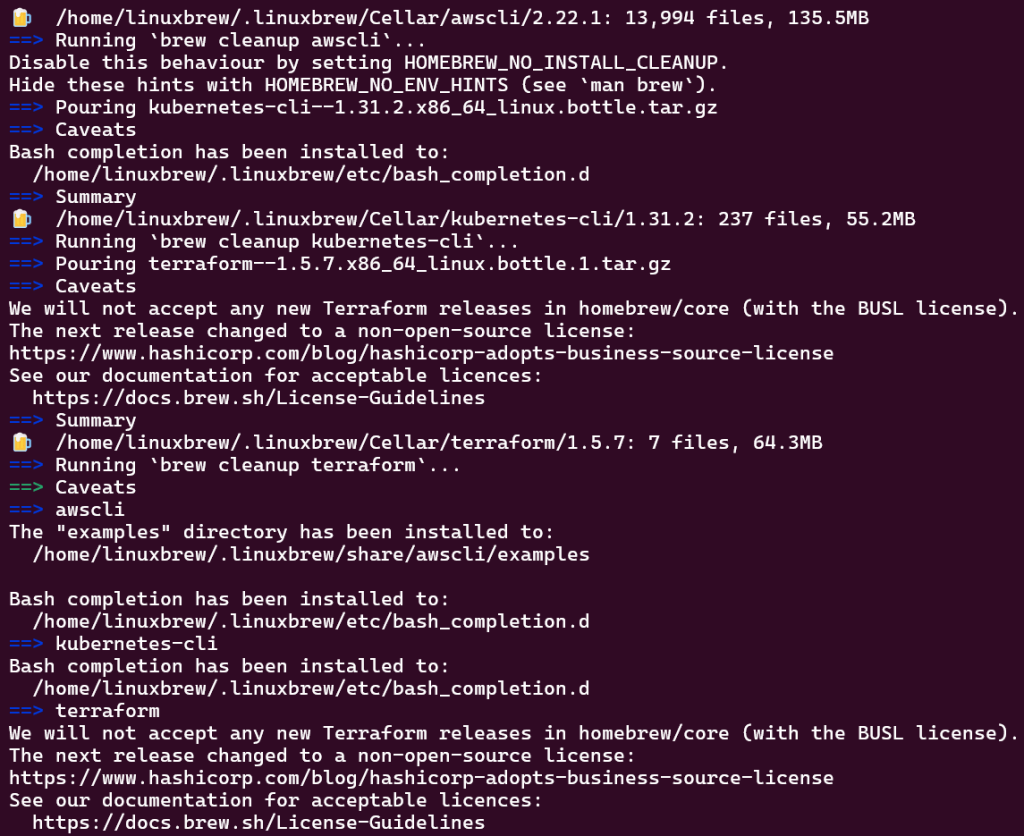
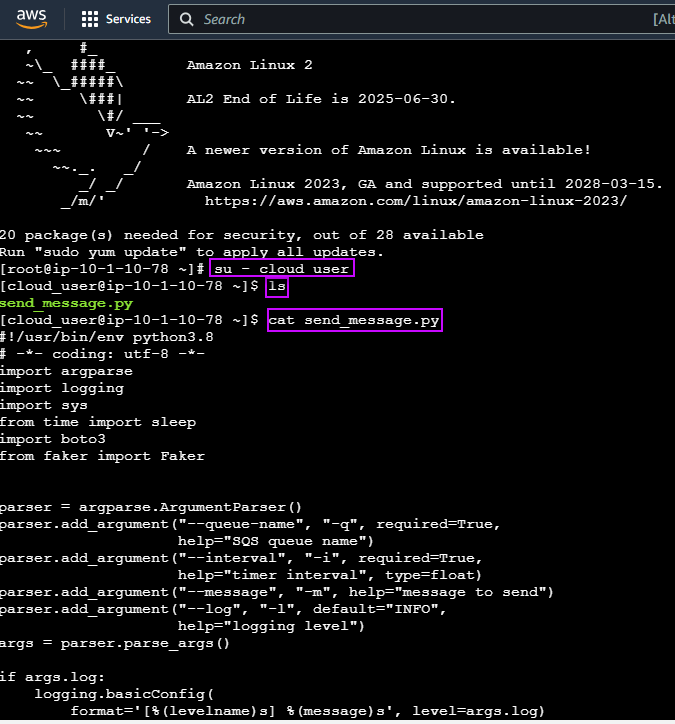
Set up the goodies:

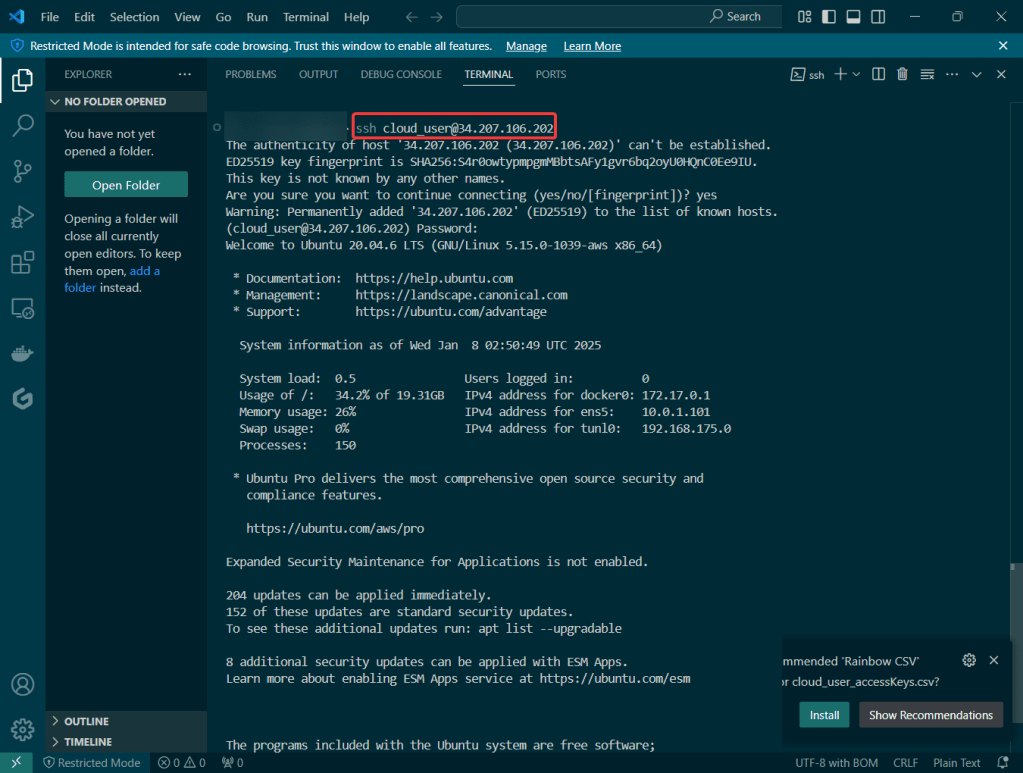
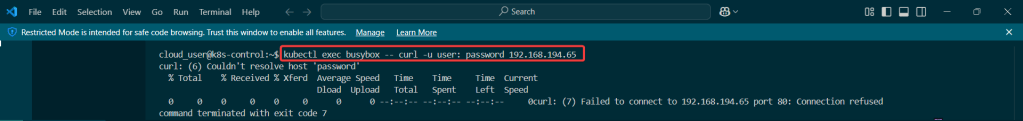
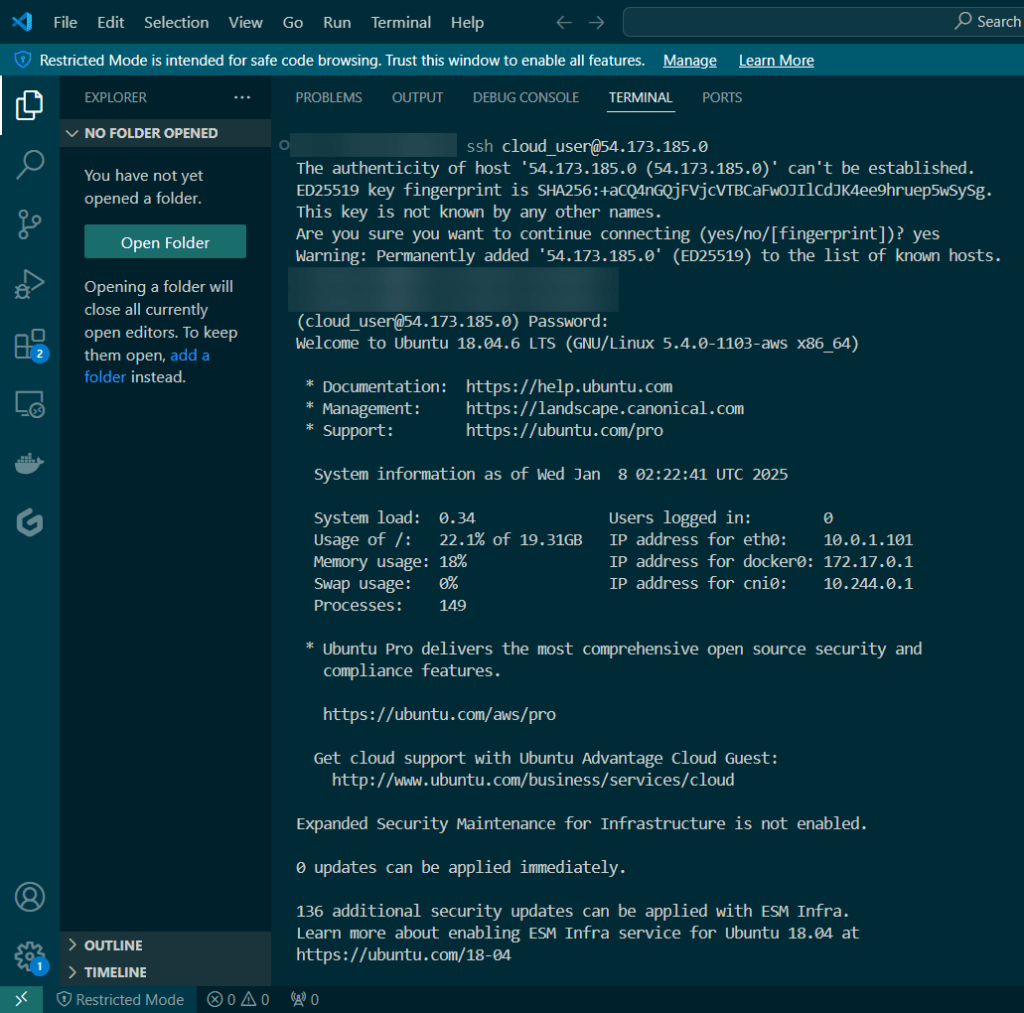
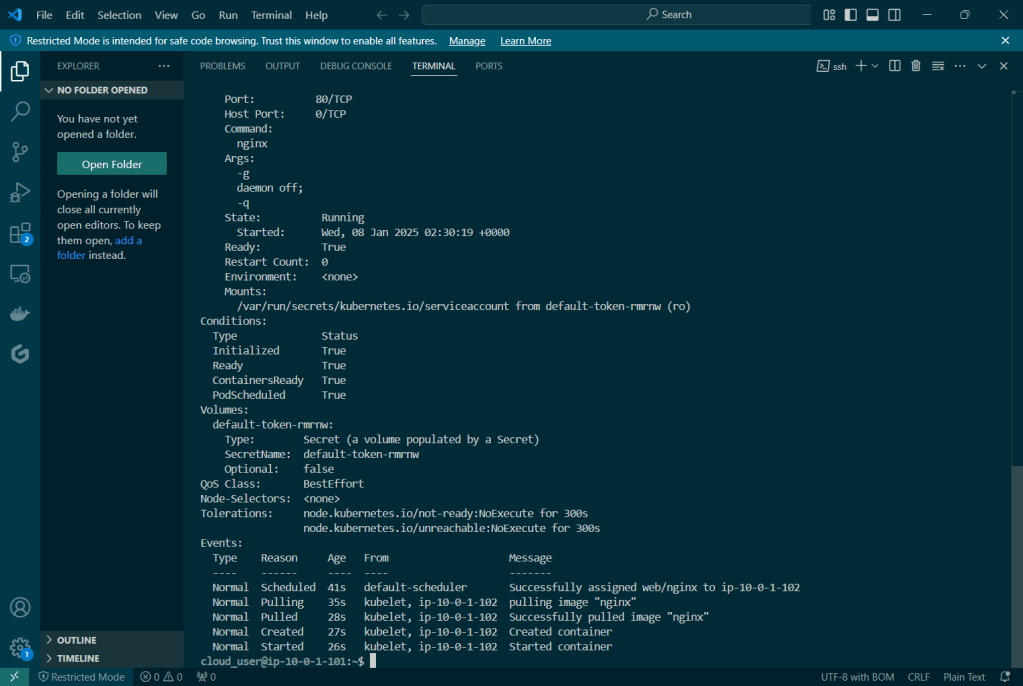
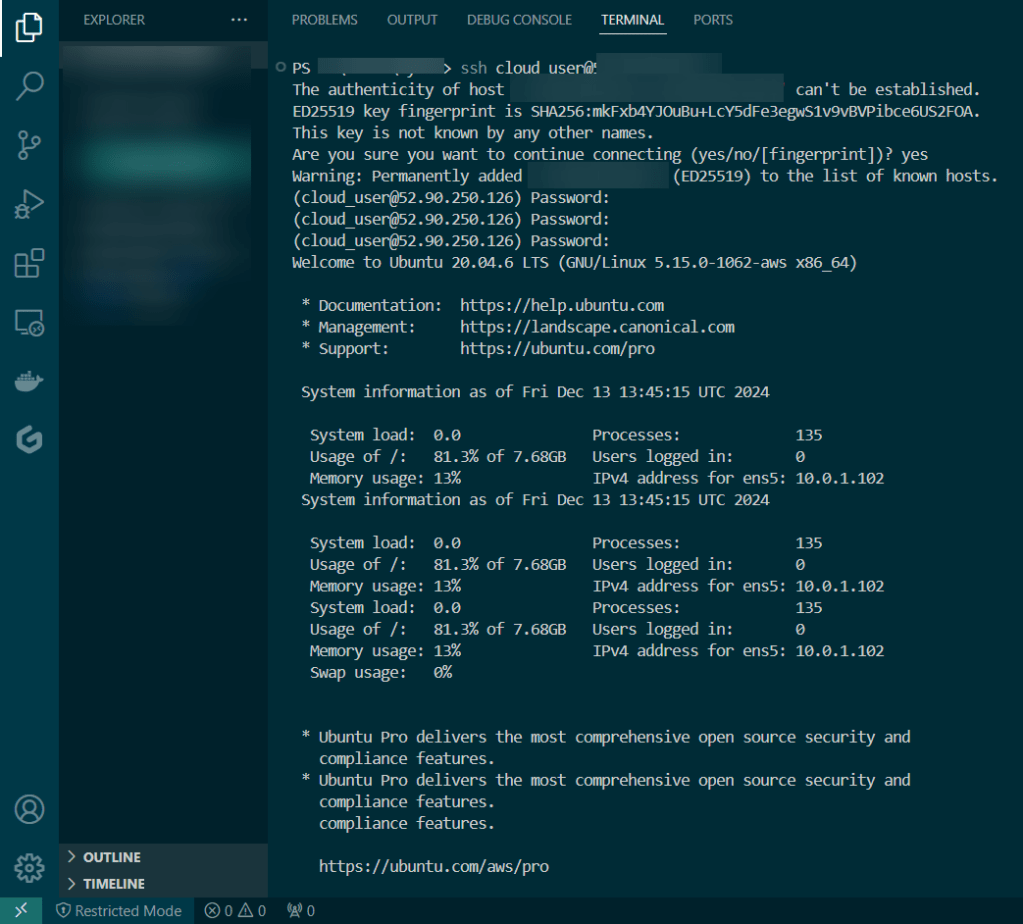
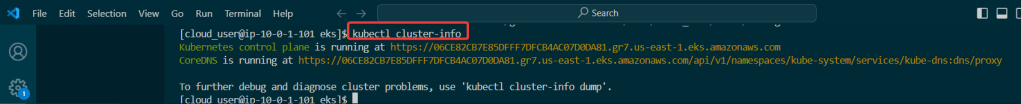
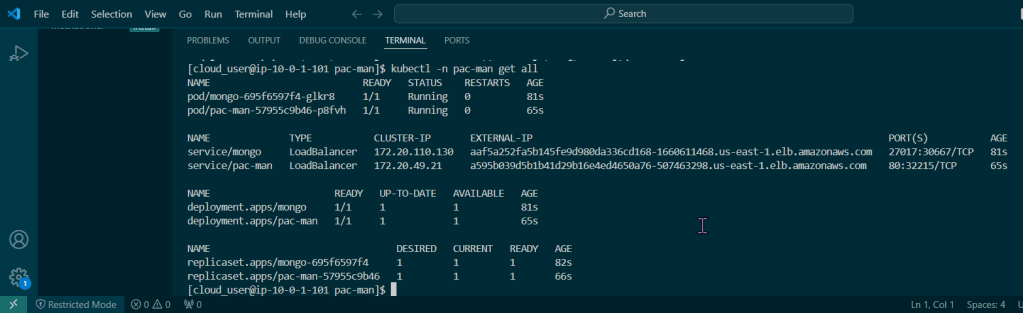
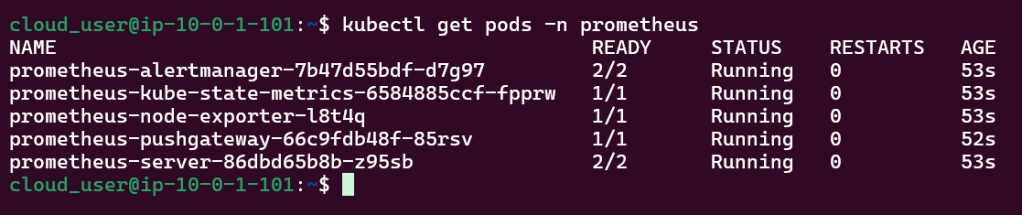
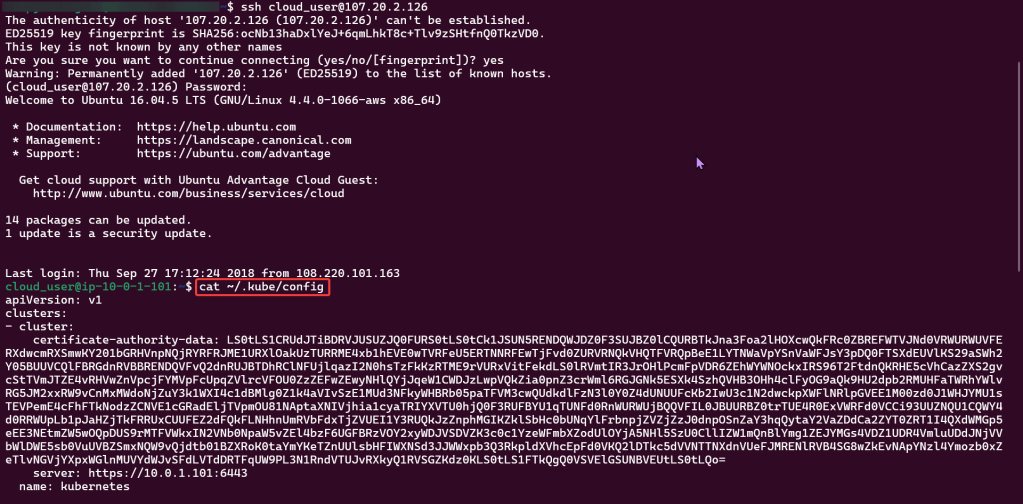
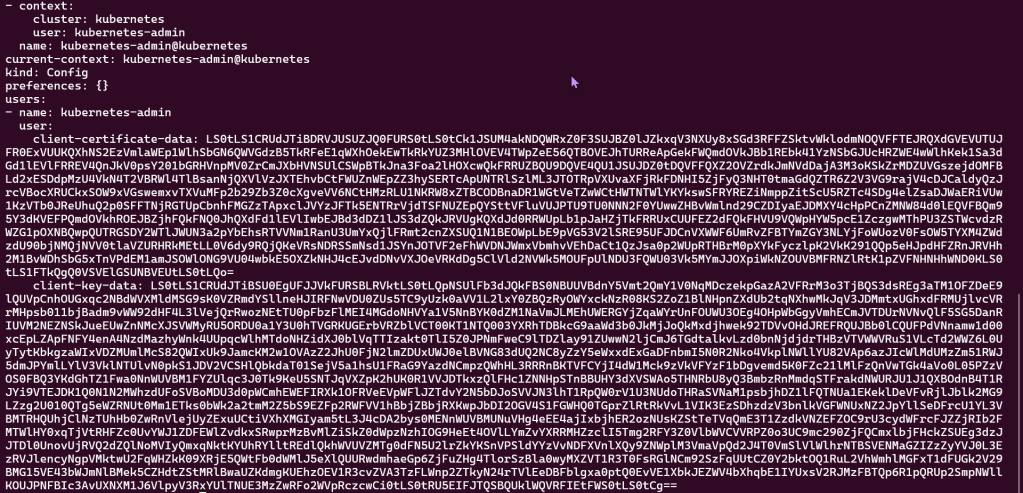
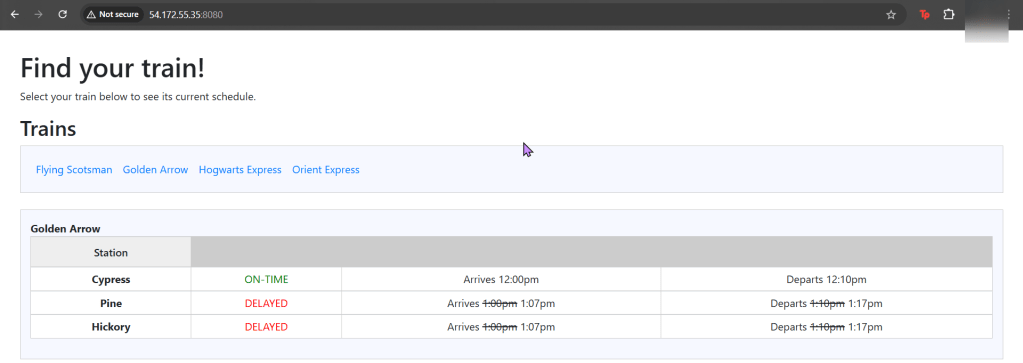
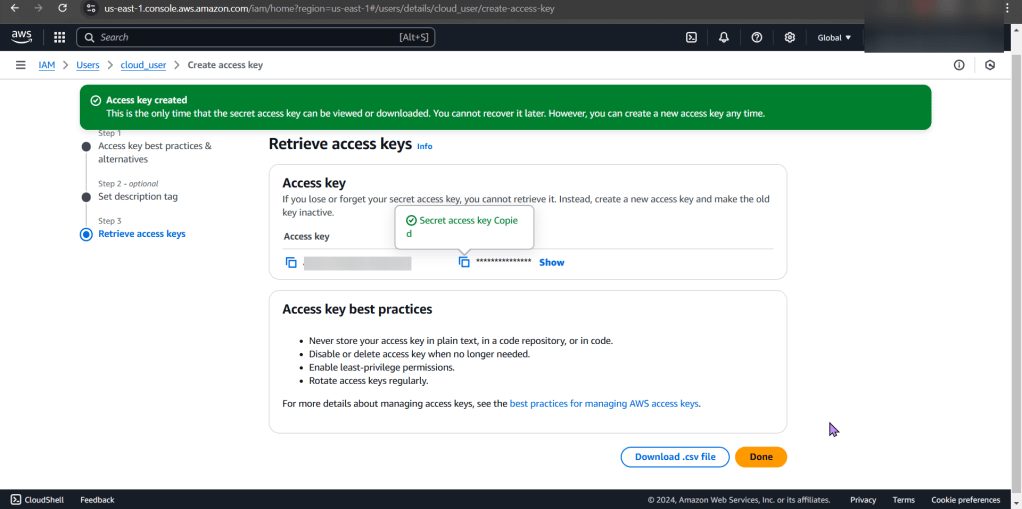
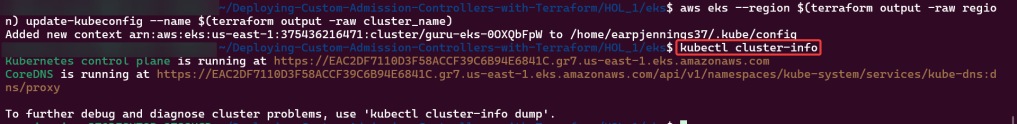
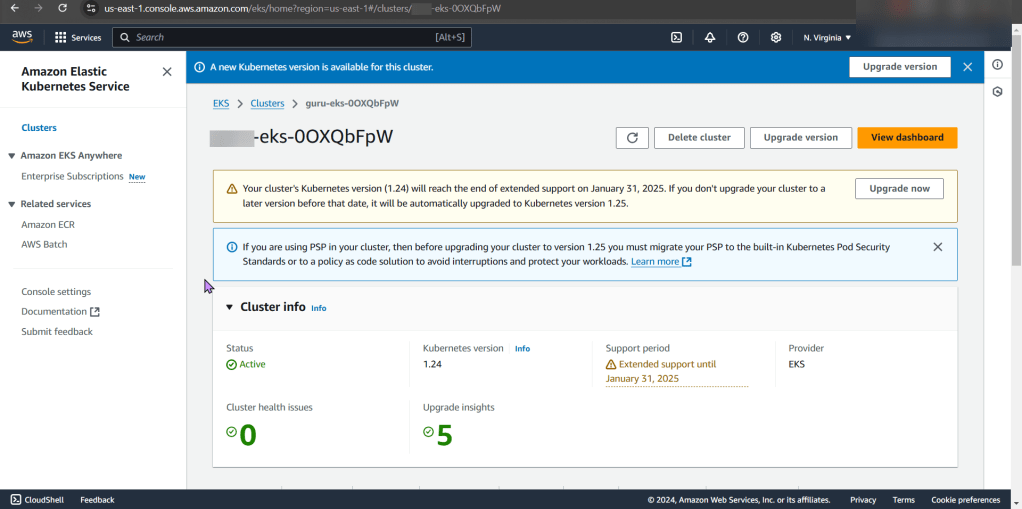
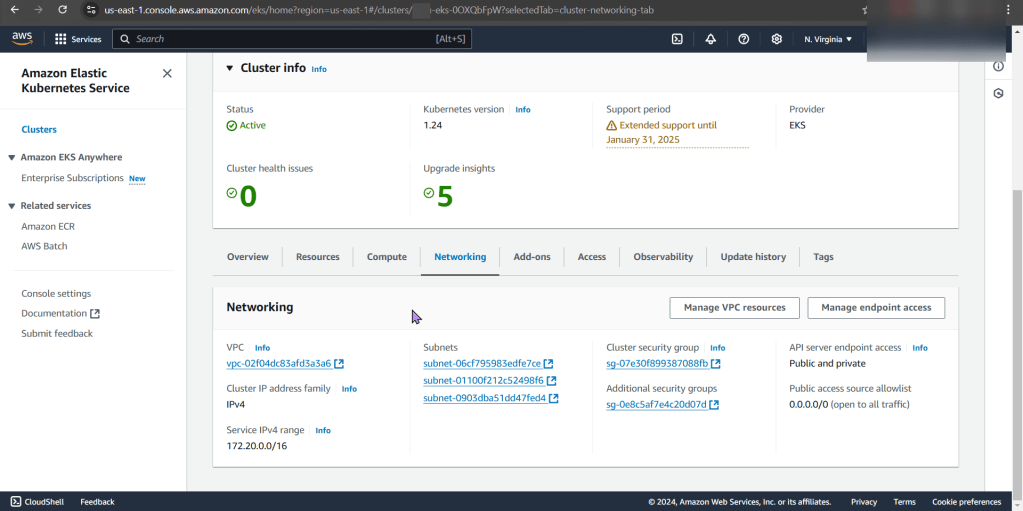
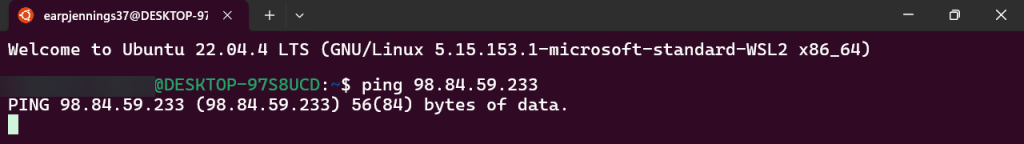
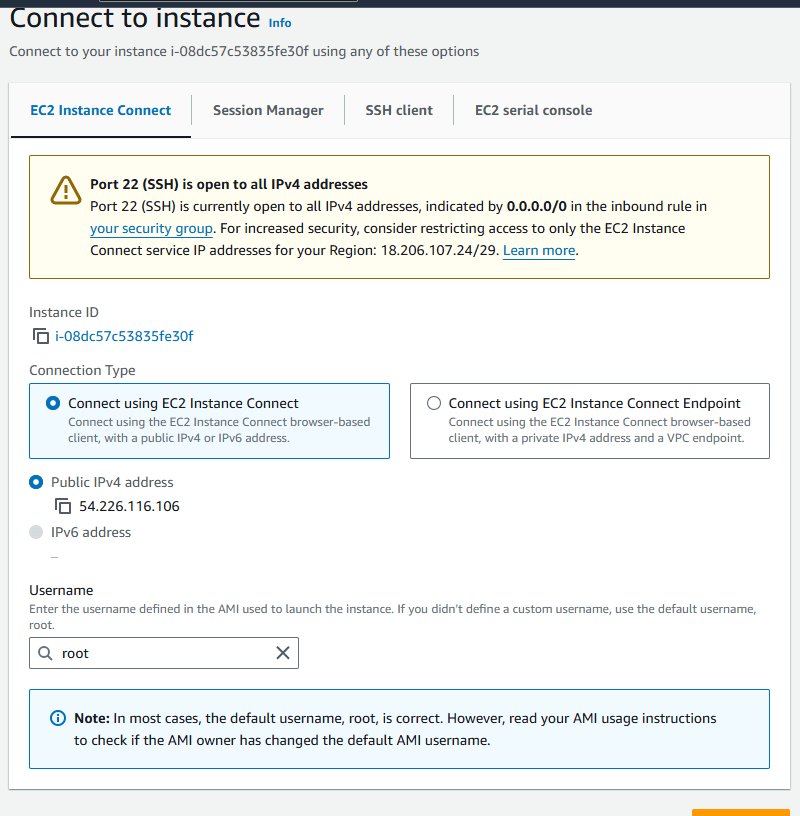
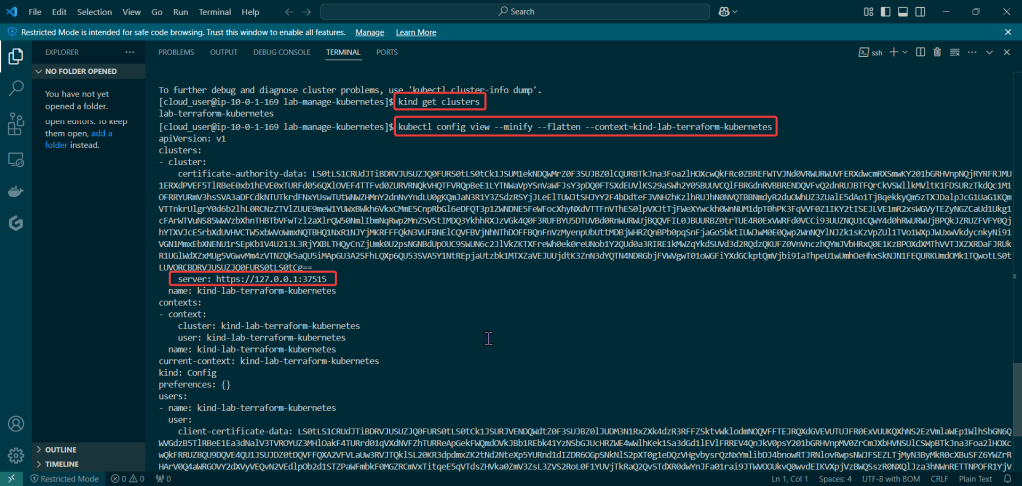
Check to see cluster is created & get SSL info for server IP address:
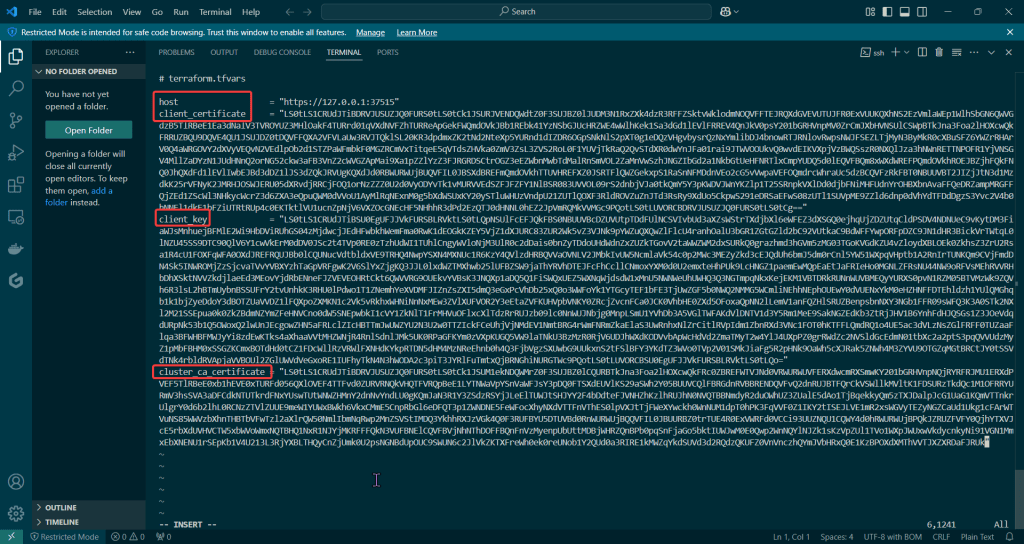
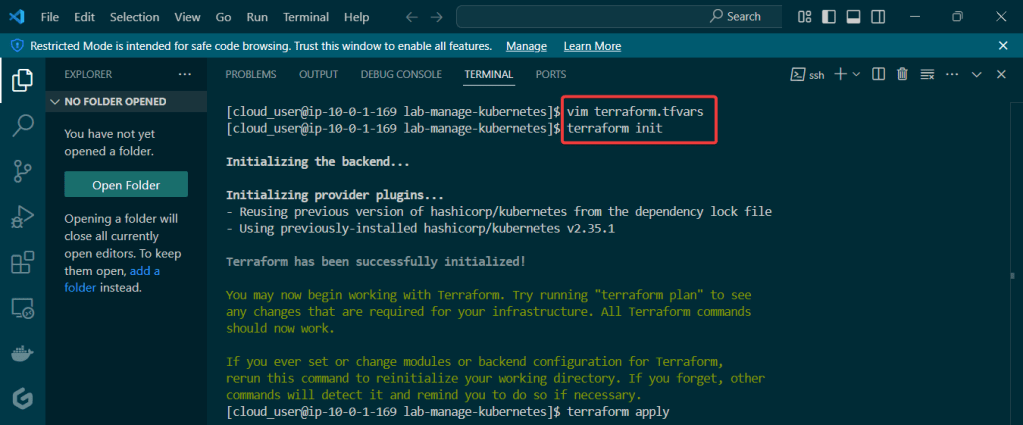
Edit Variables file:
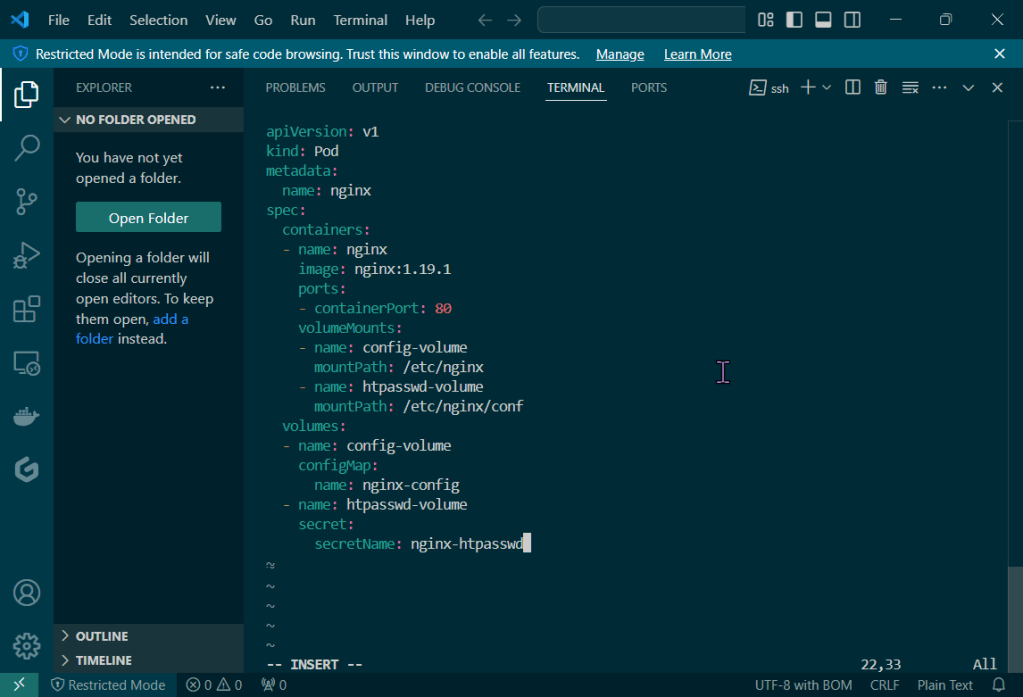
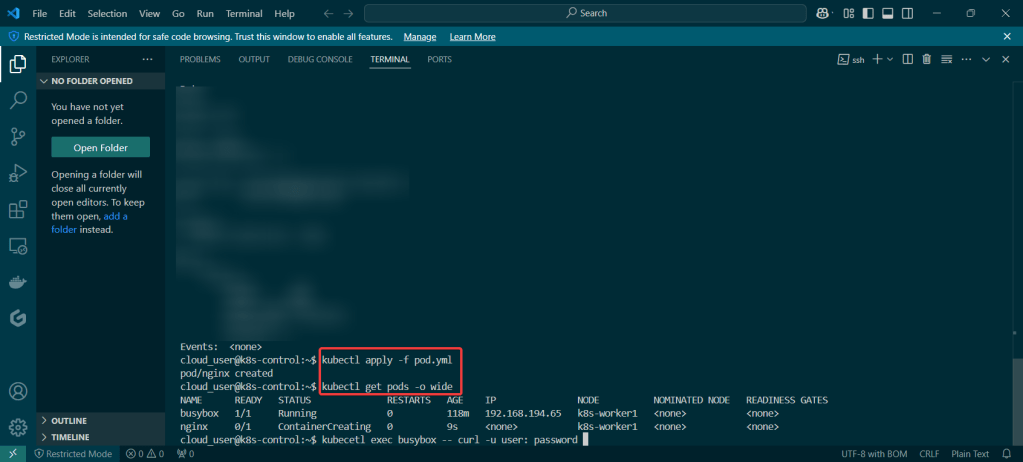
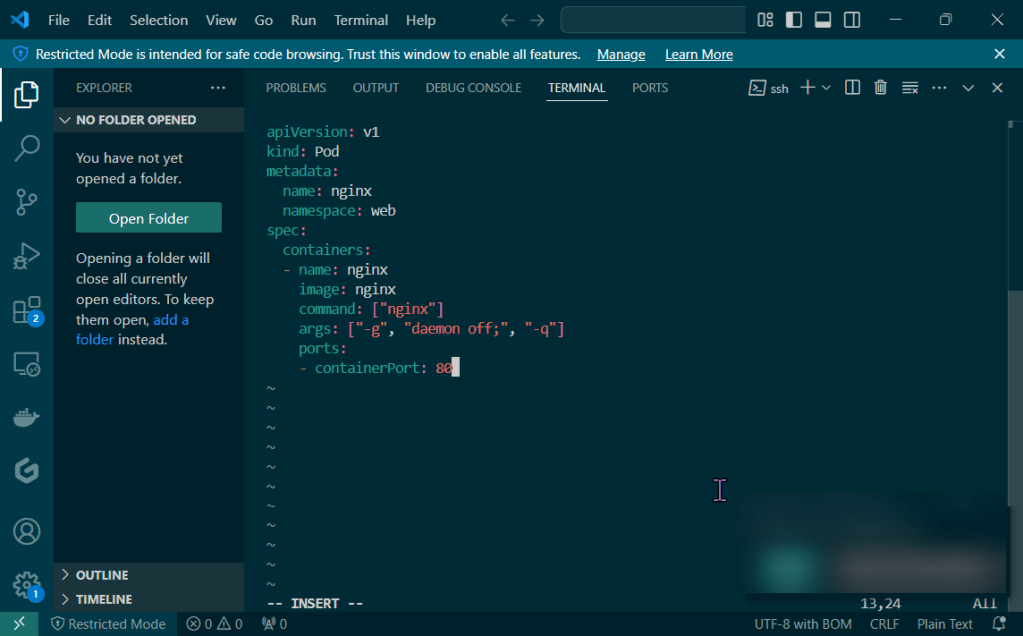
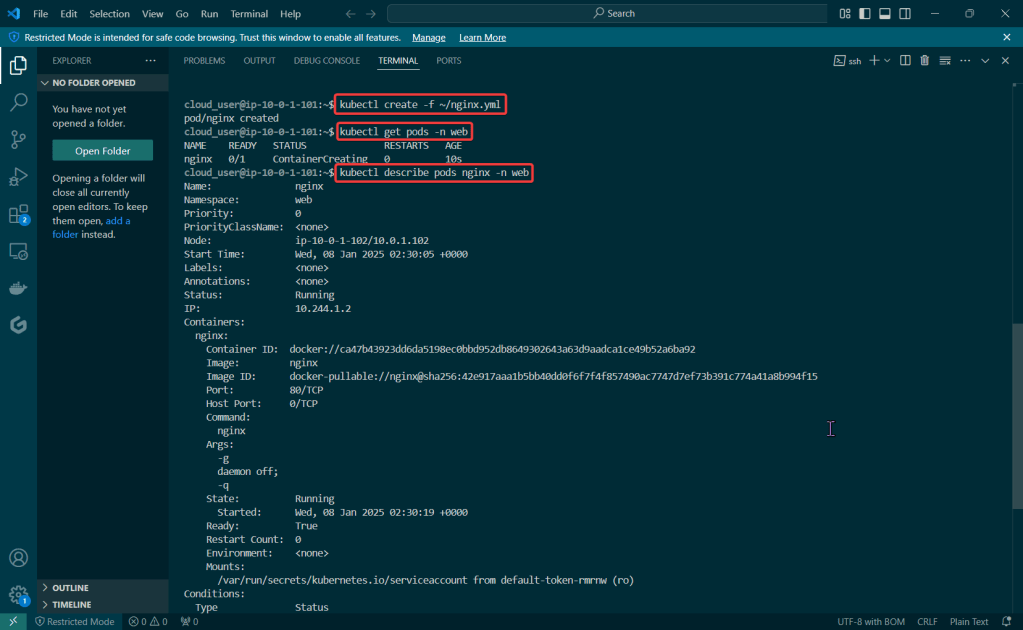
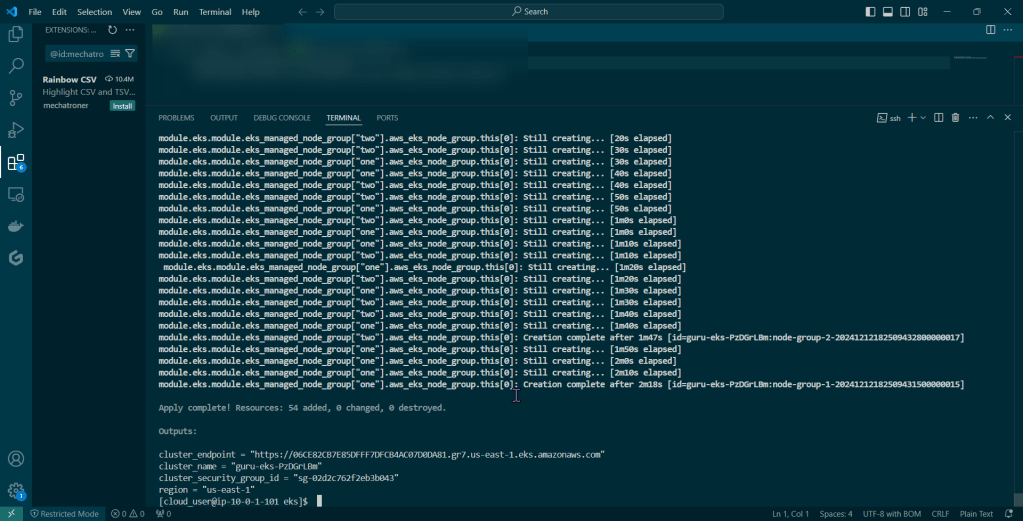
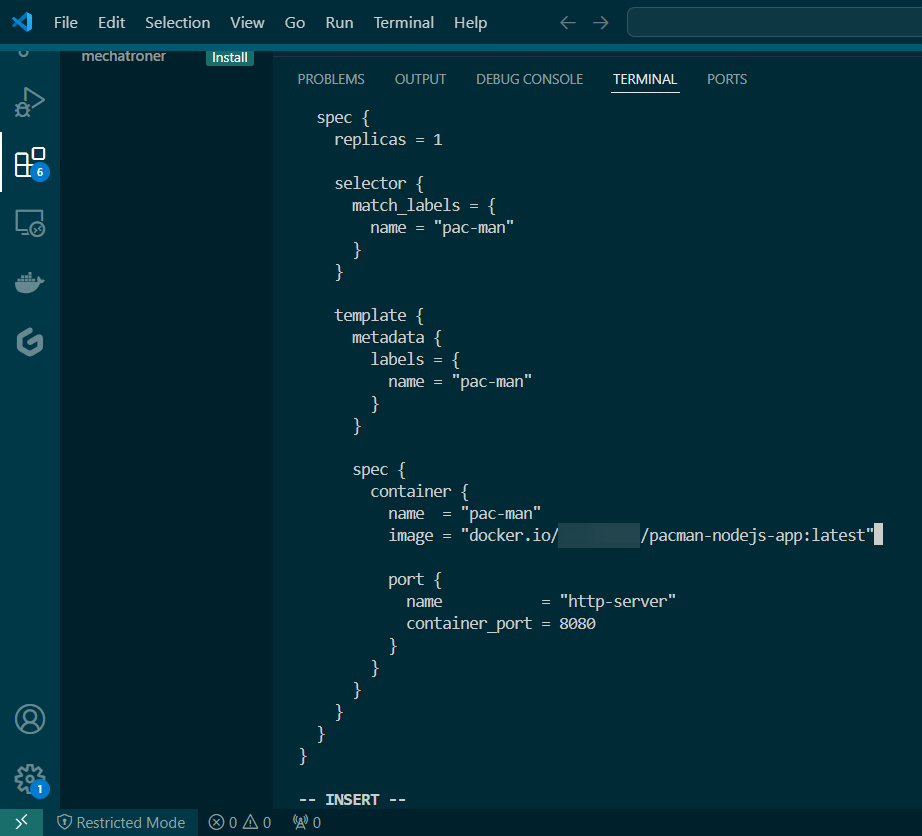
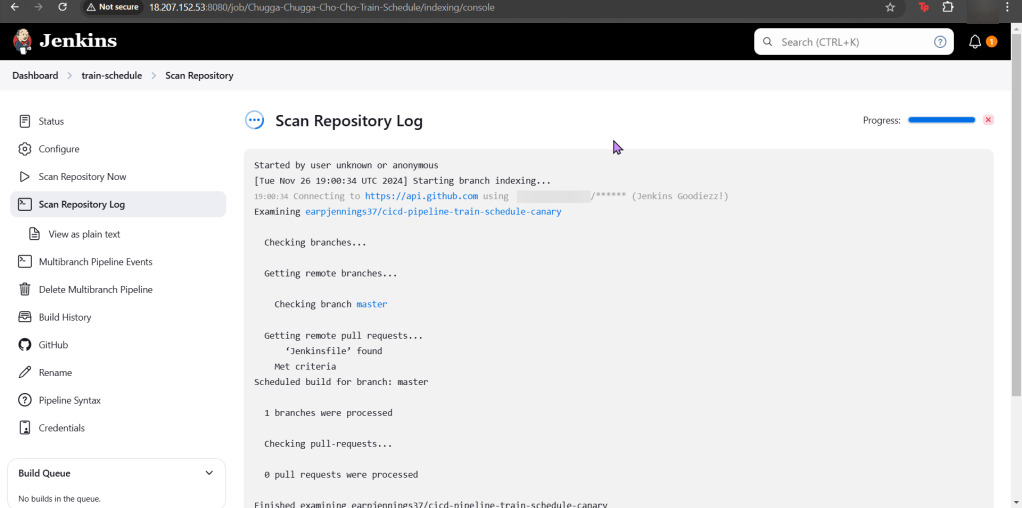
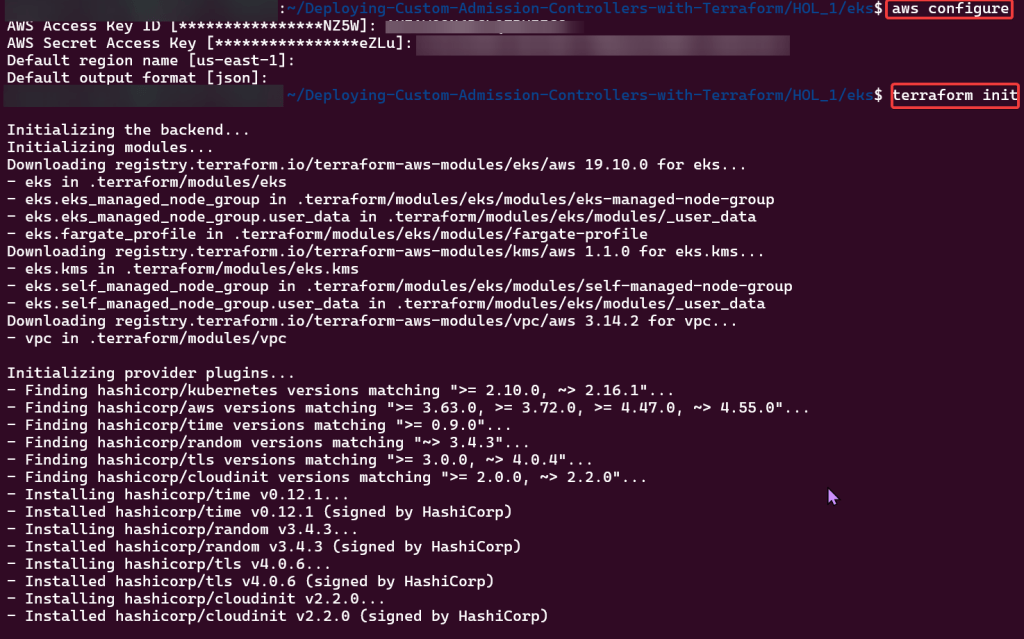
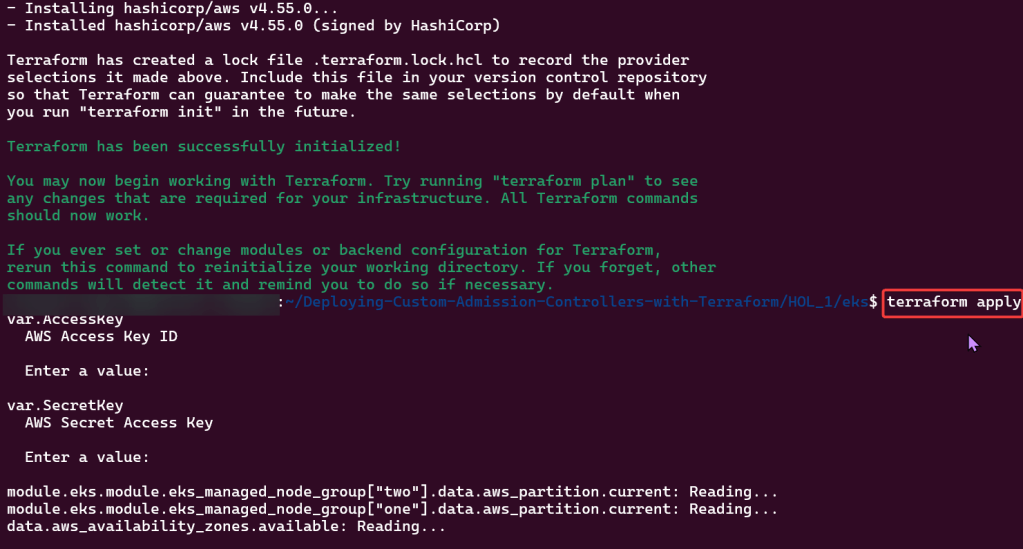
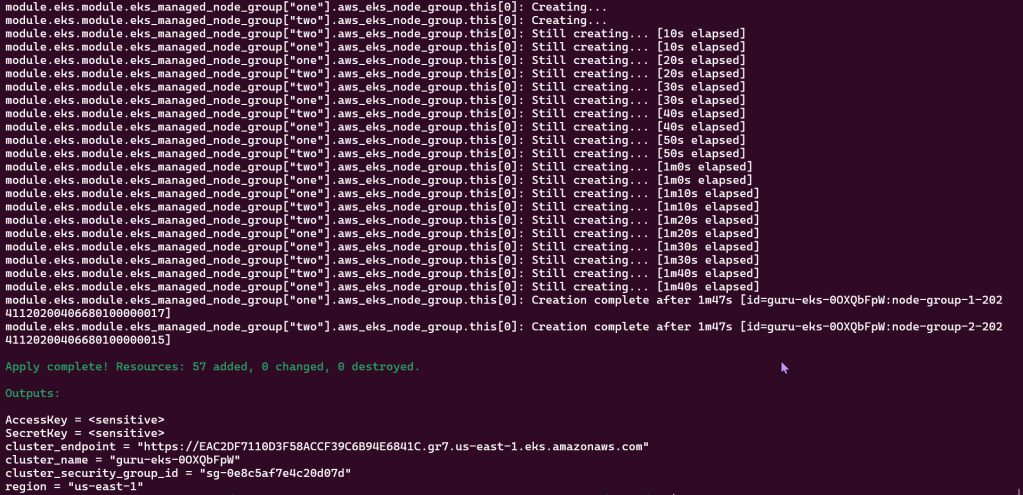
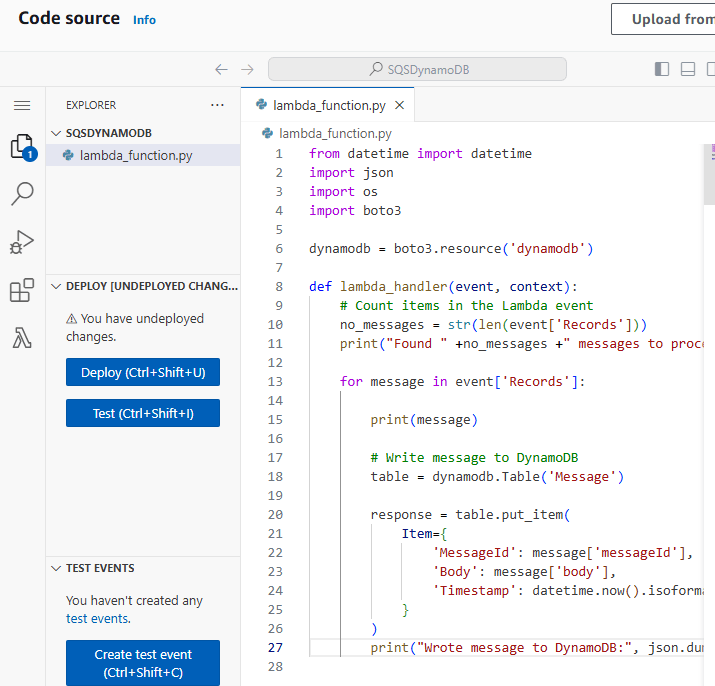
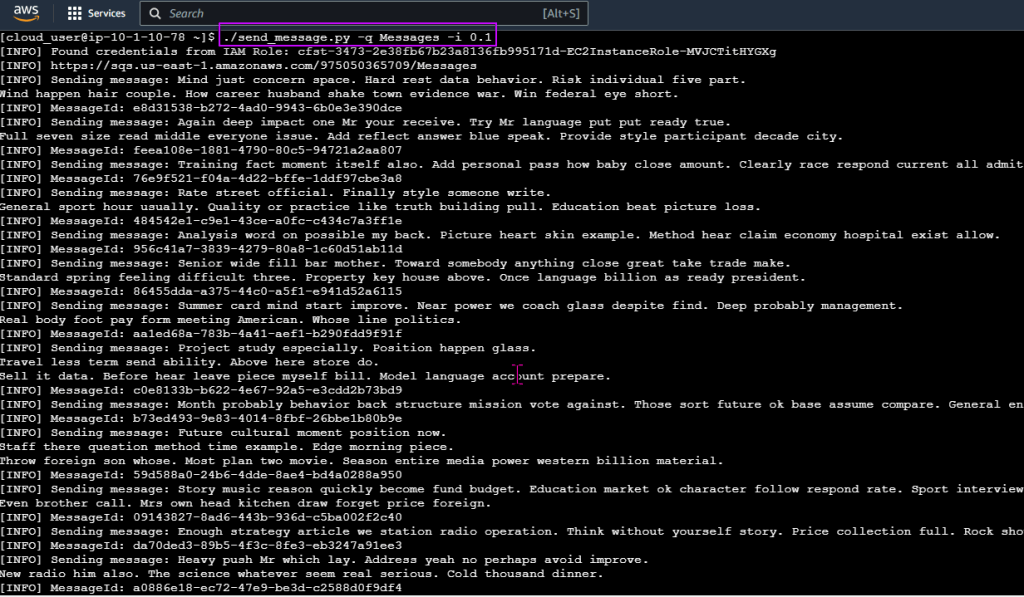
Deployed NGINX nodes using Terraform:
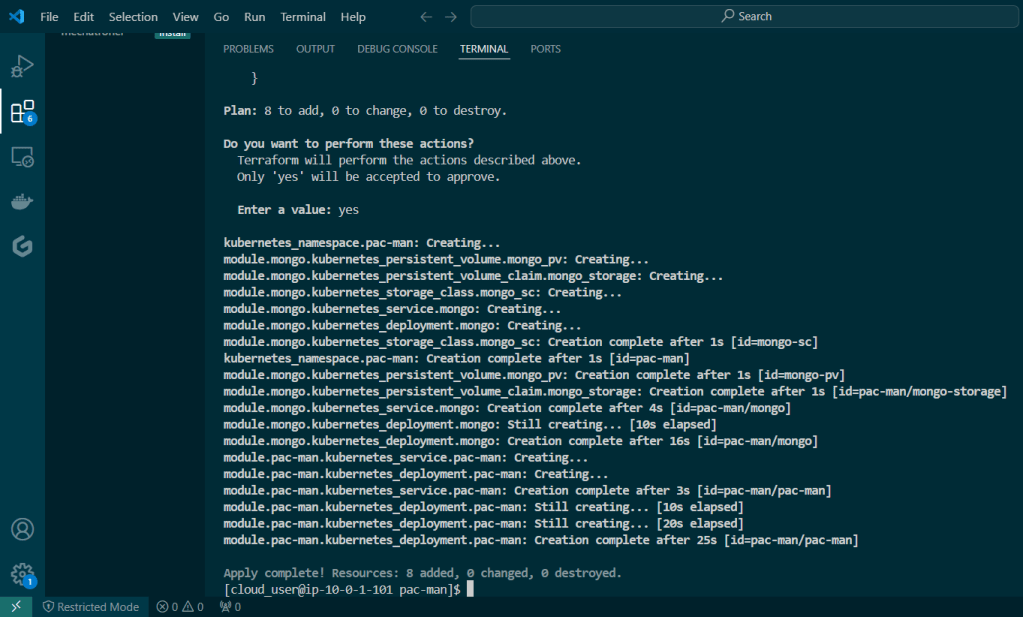
Terraform init & apply:
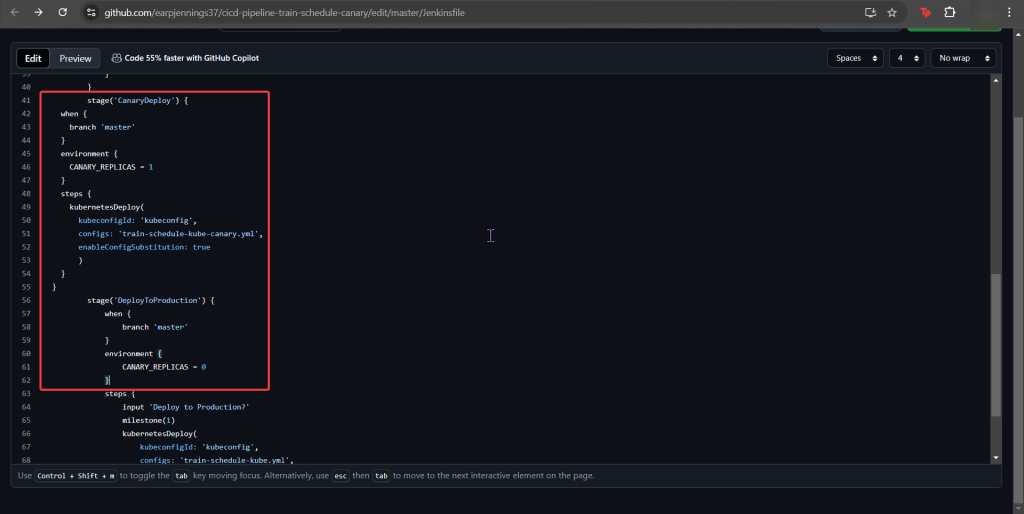
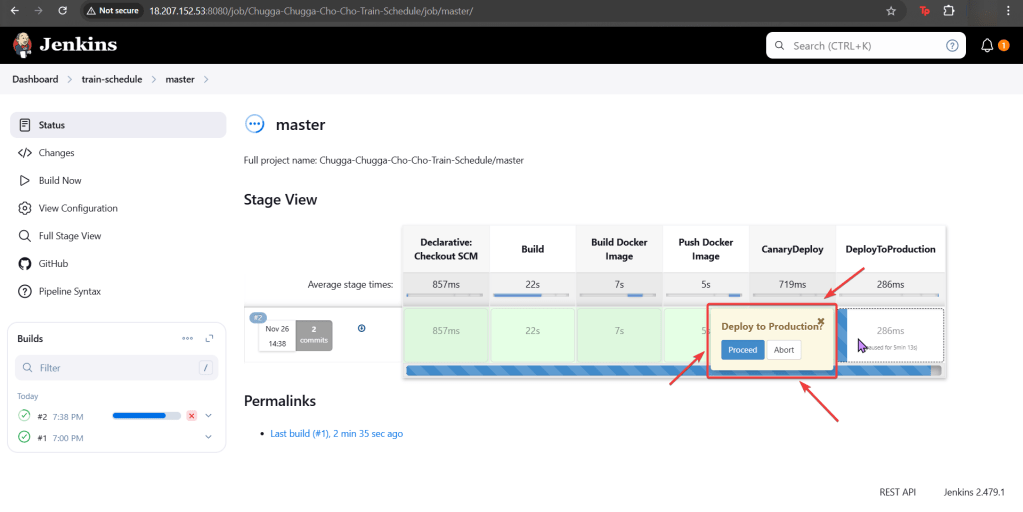
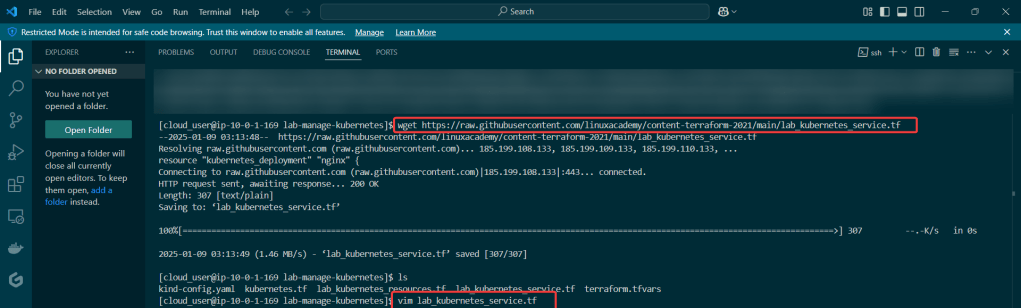
As an admin I deployed a NodePort to Kubernetes clstuer w/NGINX Nodes:
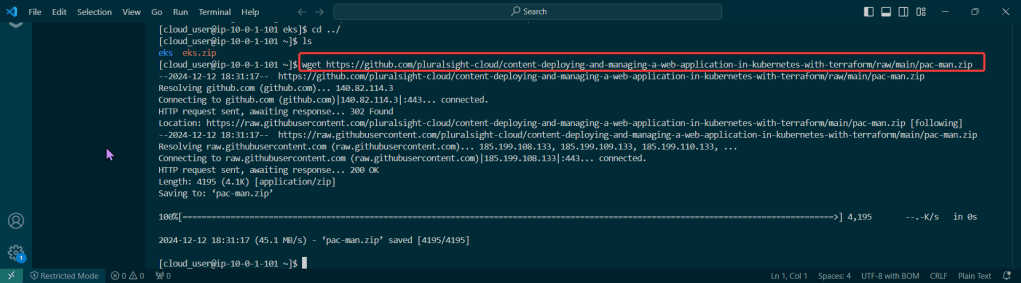
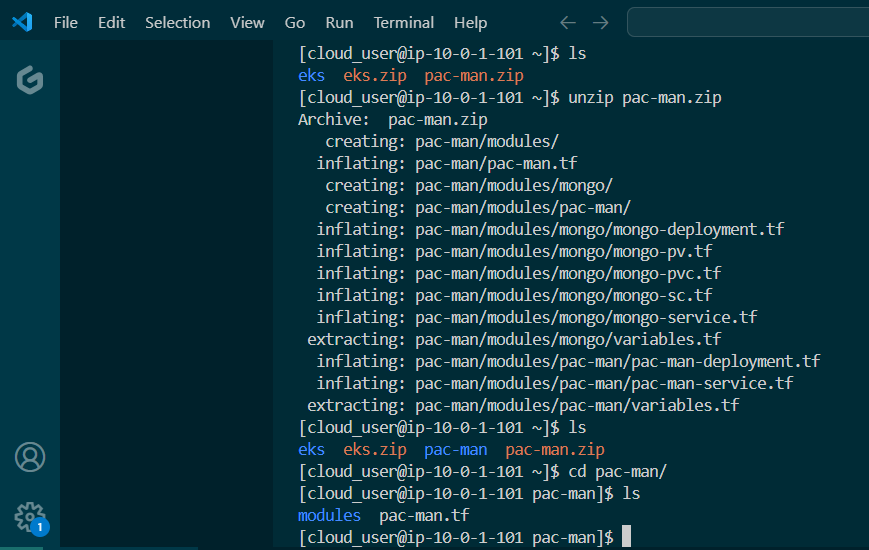
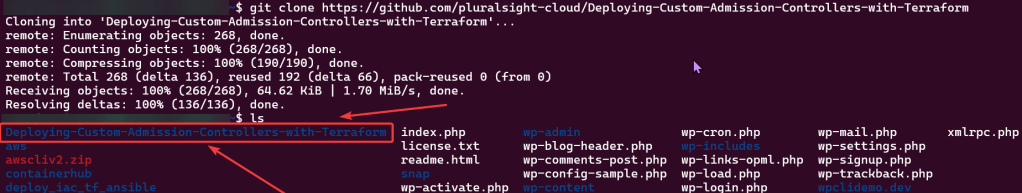
Get the TF config file:
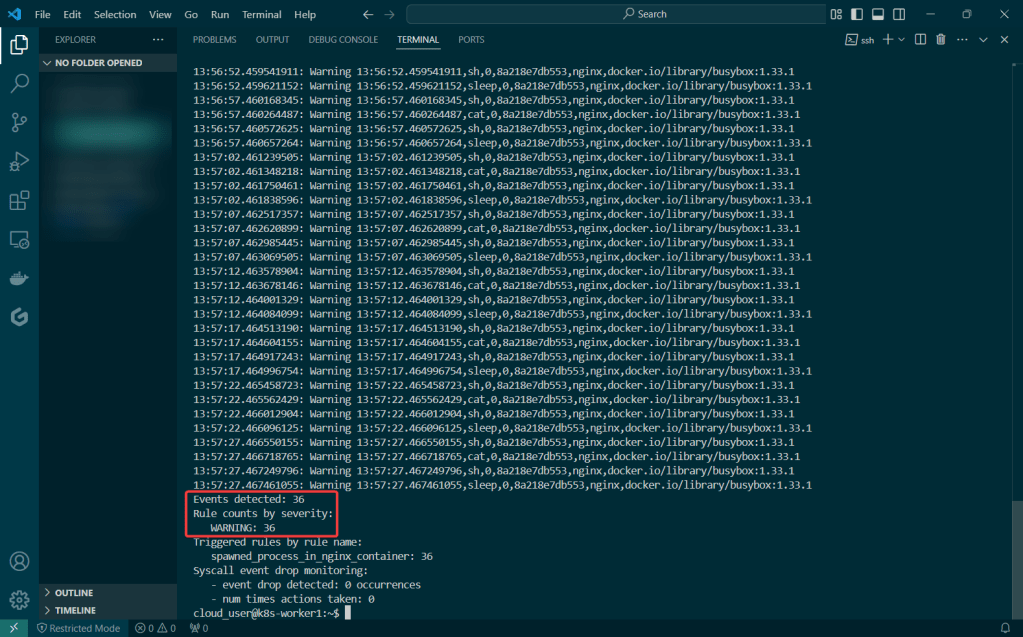
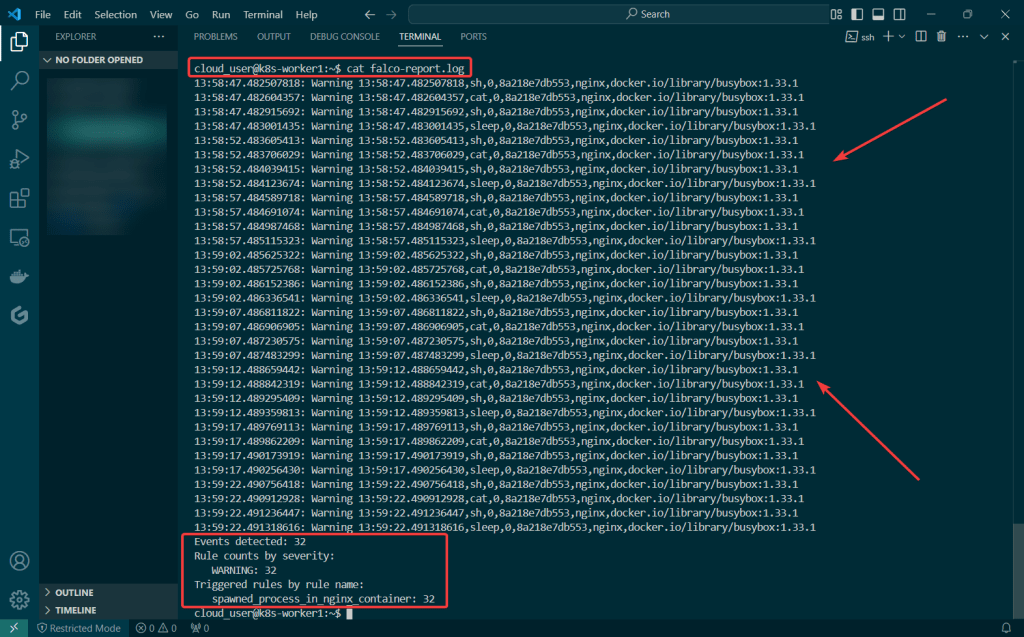
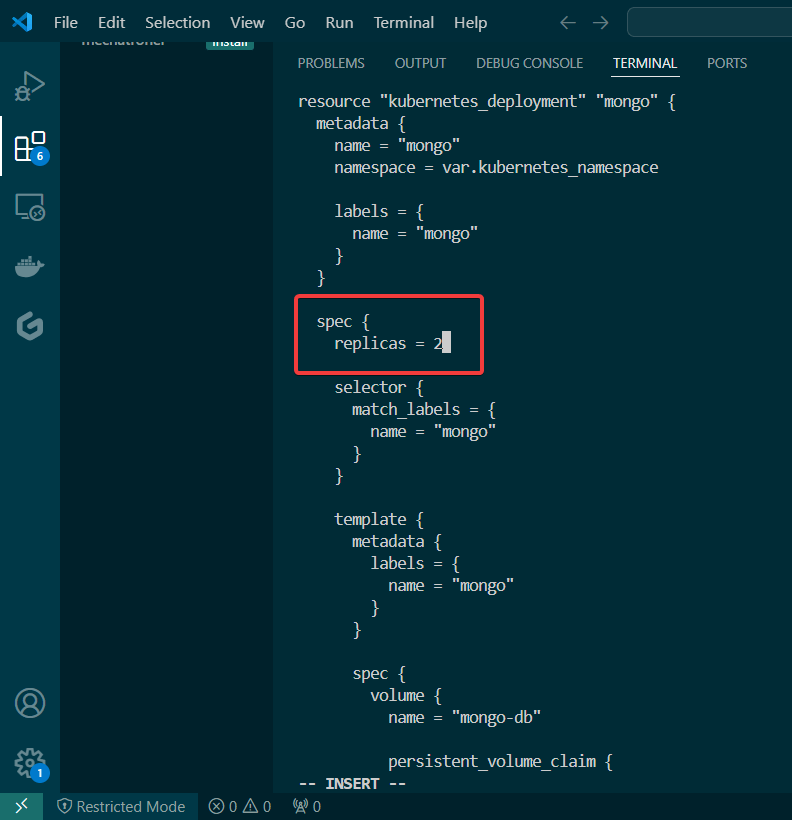
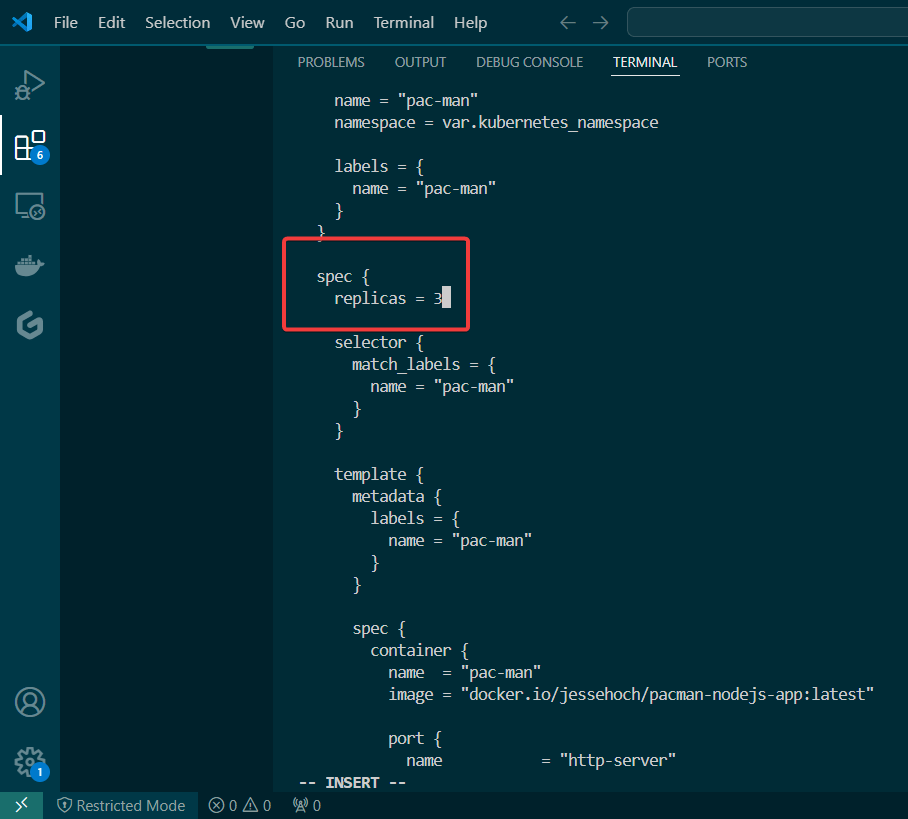
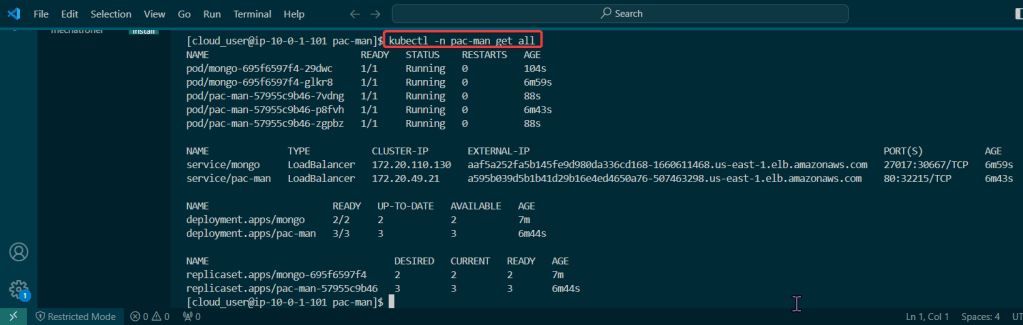
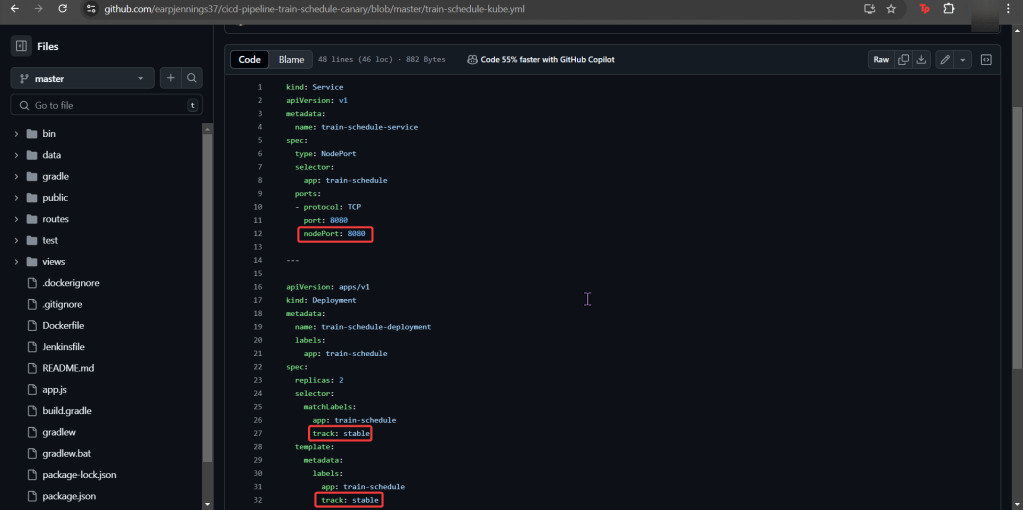
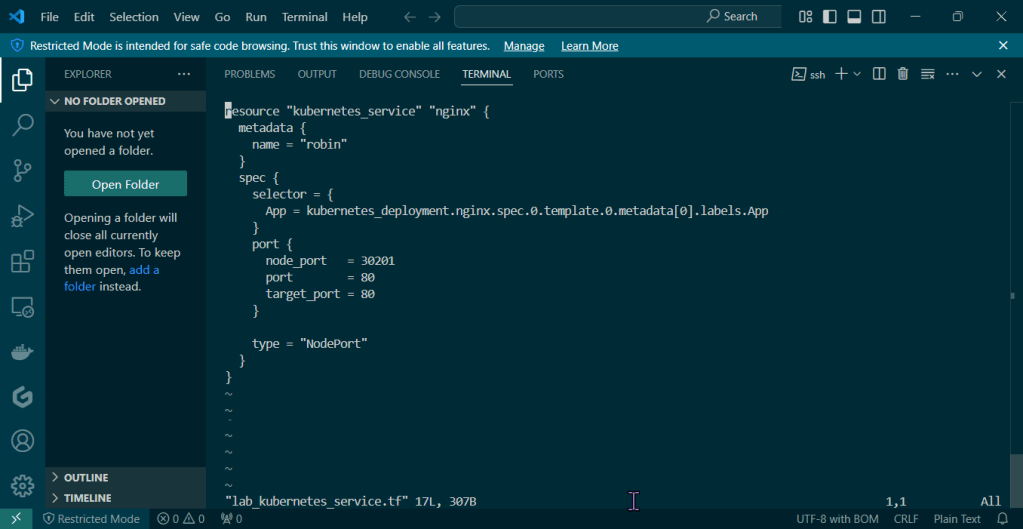
Used Terraform to deploy NodePort & scale NGINX nodes:
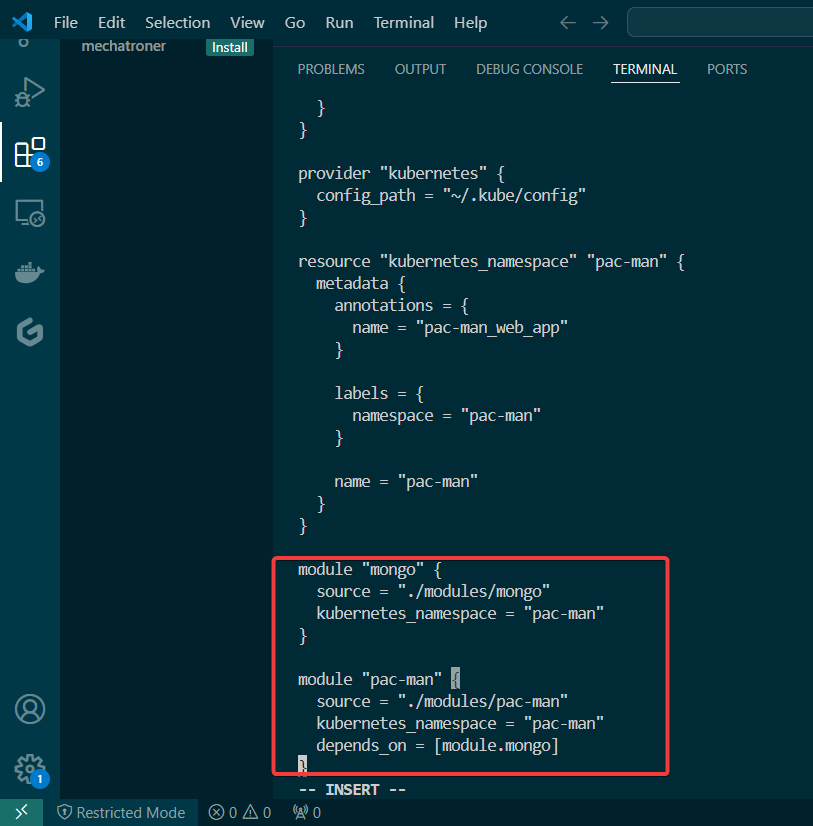
Vim lab_kubernetes_service.tf:
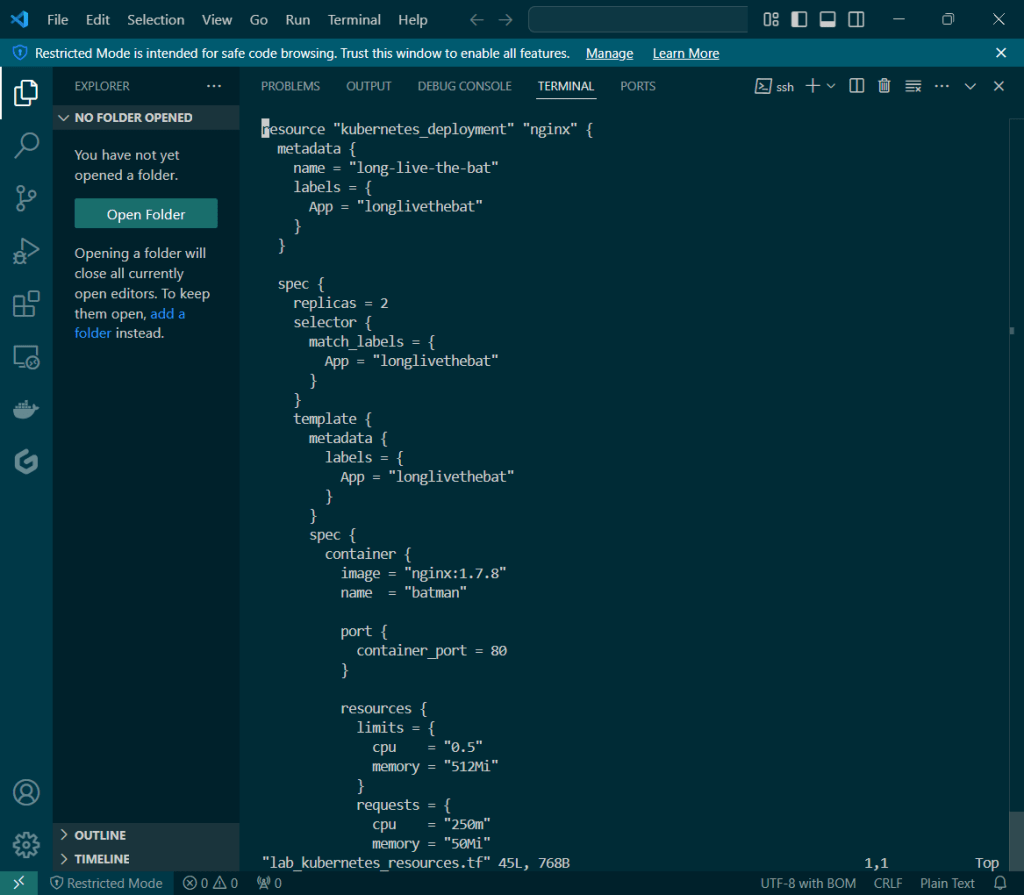
vim lab_kubernetes_resources.tf:
….DESTROY video boy (…..what is Benchwarmers..):
- Terraform Destroy
- kind delete cluster –name lab-terraform-kubernetes