
Blog post includes covering K8s Automation, Telemetry, & Observability in preparation for the KCNA.
- Helm Charts
- Prometheus
- Grafana
- Probes & Kubelet
- When Nodes Fail
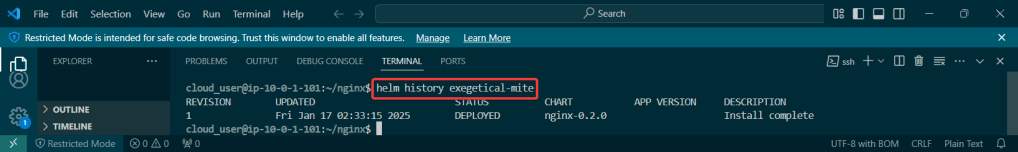
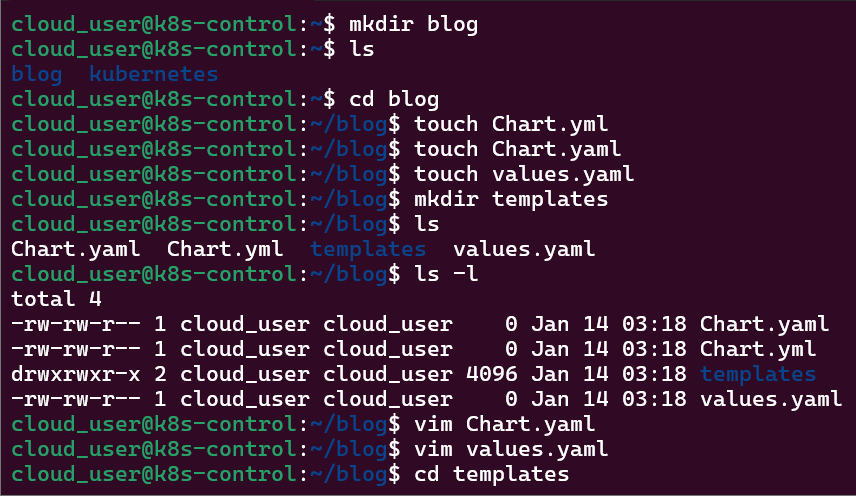
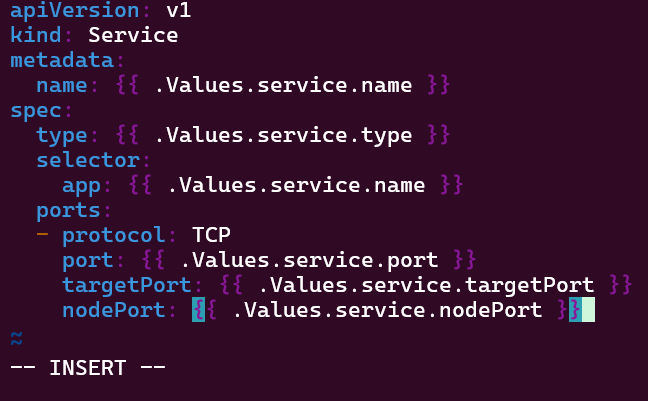
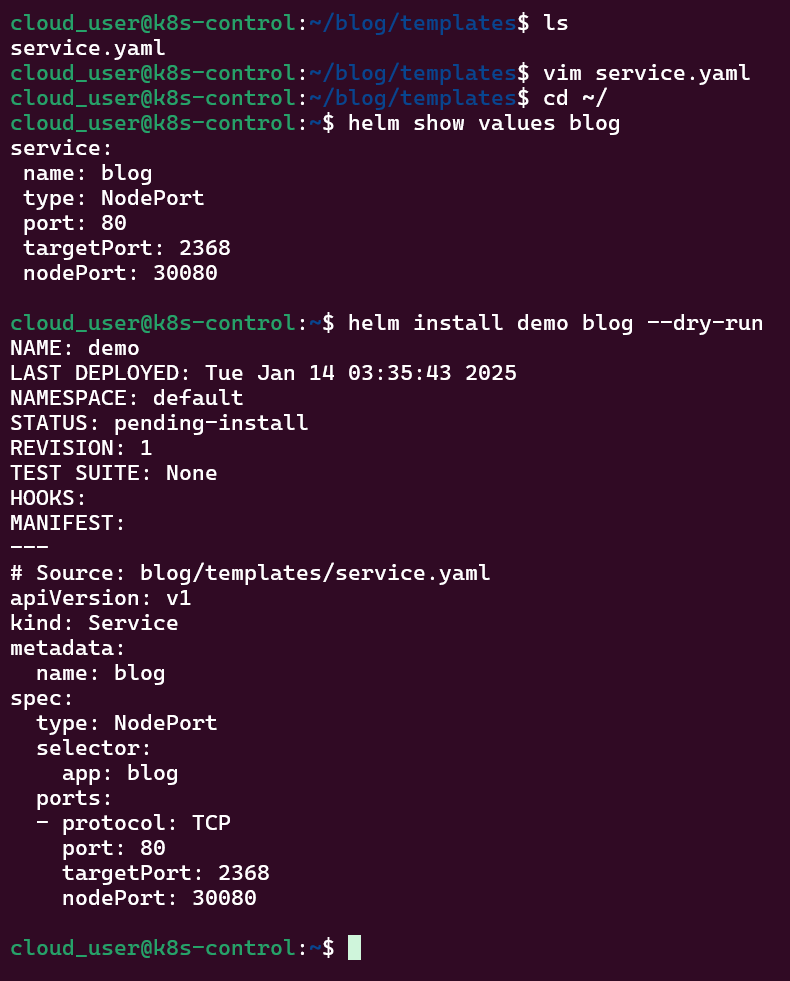
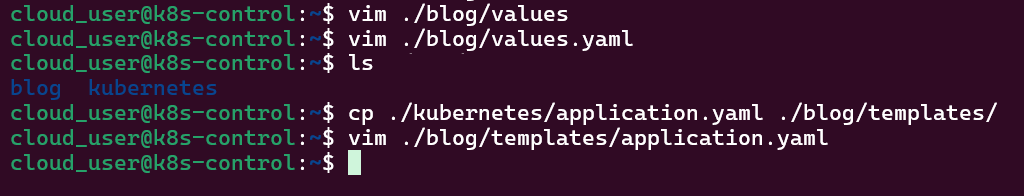
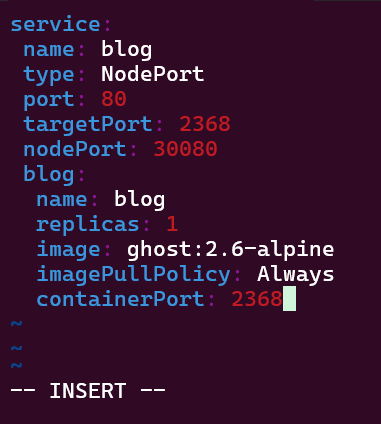
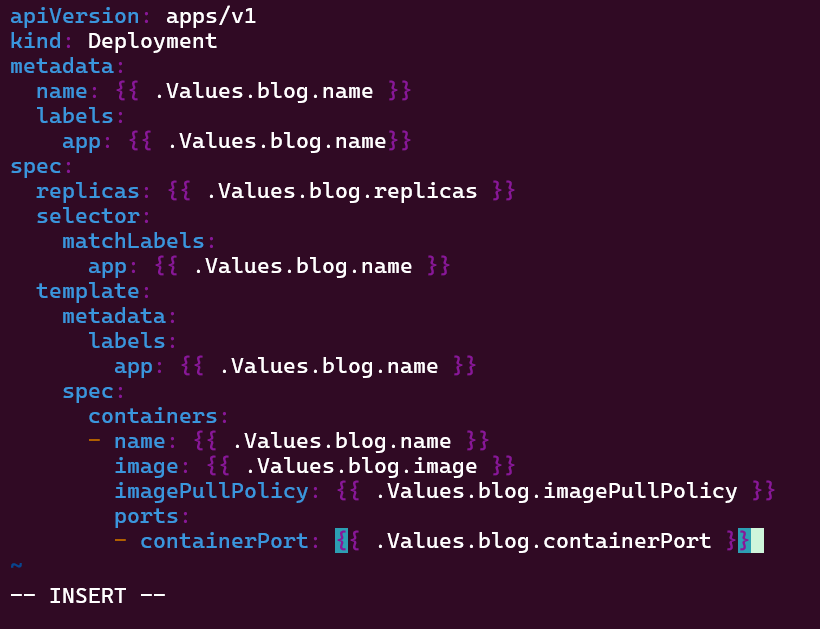
Helm Charts: there magic simply put..conduct your standard linux practices & can navigate thru your helm chart install
# apt update && apt install -y git tree
# curl https://raw.githubusercontent.com/helm/helm/main/scripts/get-helm-3 | bash
# cd flappy-app
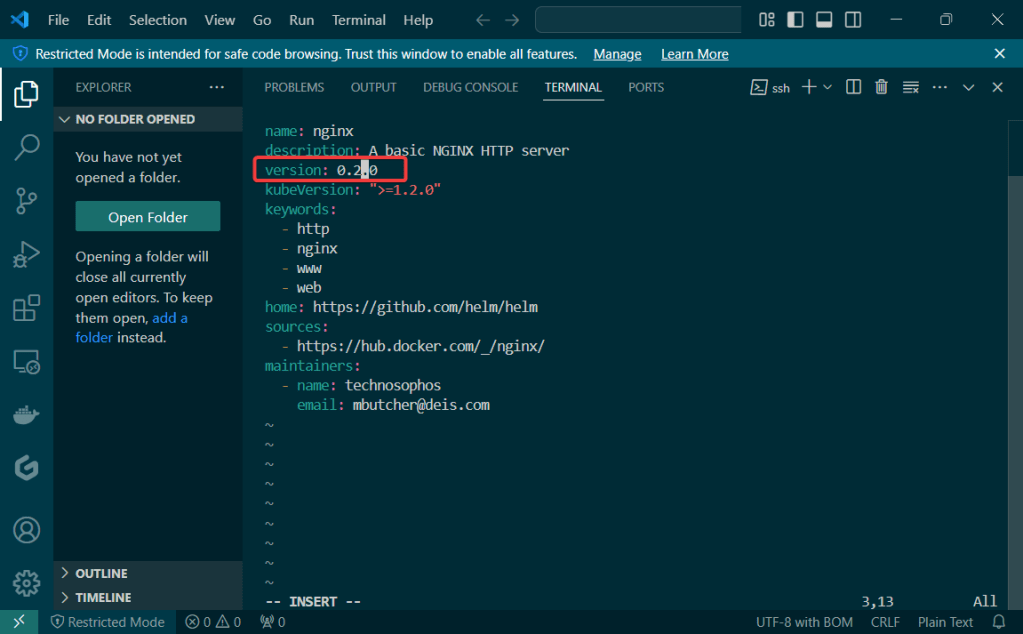
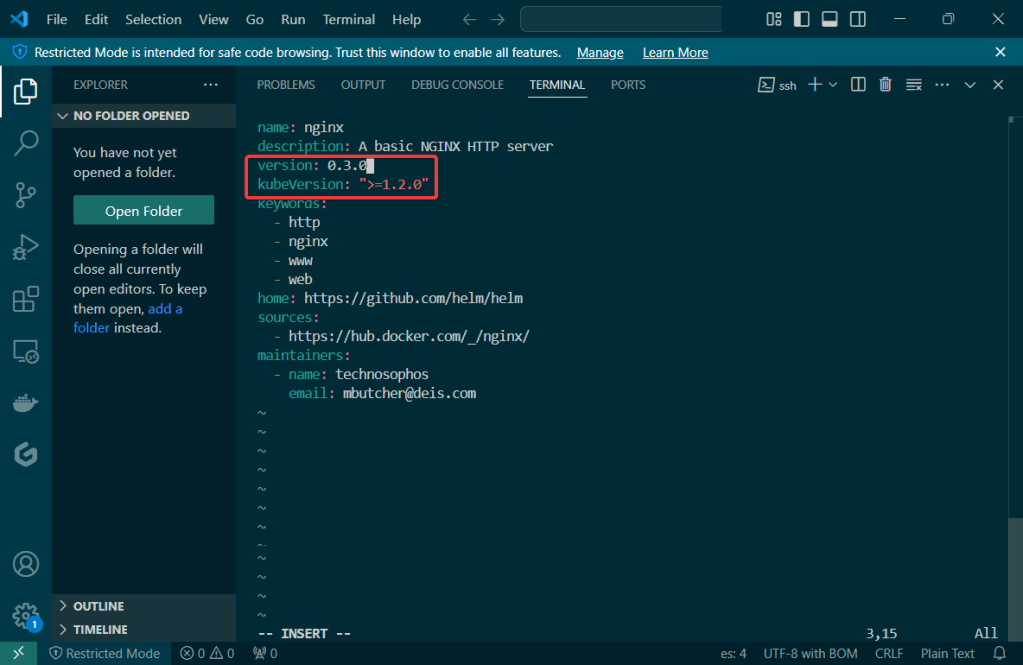
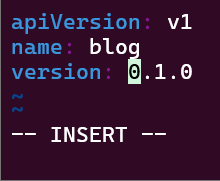
# vim Chart.yaml
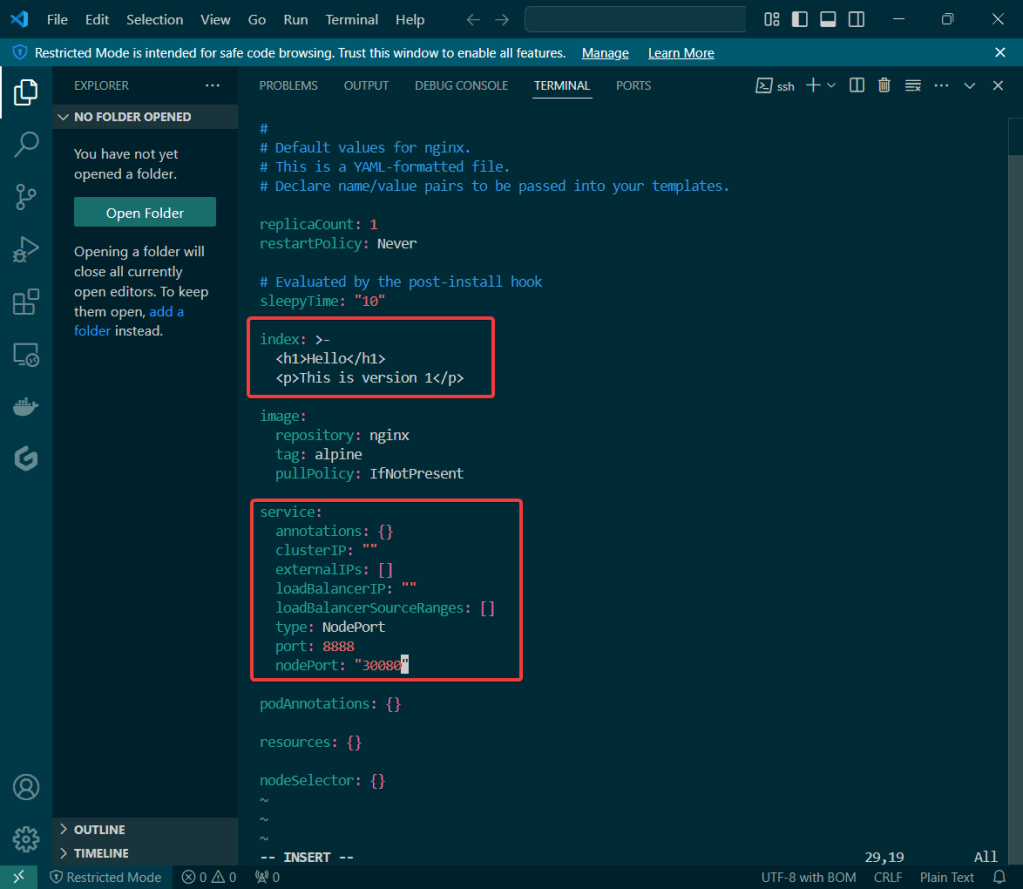
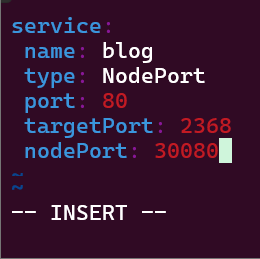
# vim values.yaml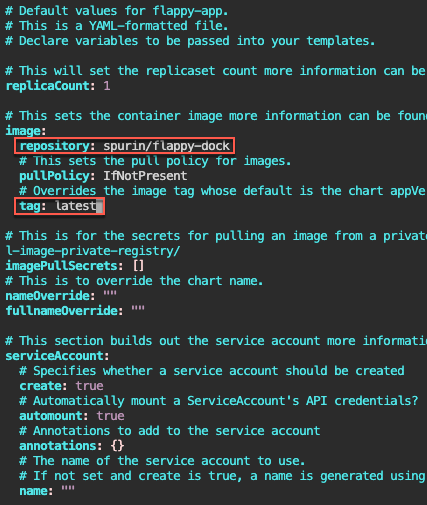
# helm install flappy-app ./flappy-app-0.1.0.tgz
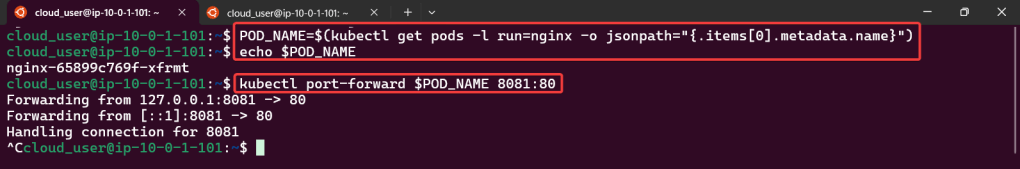
# export POD_NAME=$(kubectl get pods --namespace default -l "app.kubernetes.io/name=flappy-app,app.kubernetes.io/instance=flappy-app" -o jsonpath="{.items[0].metadata.name}"); export CONTAINER_PORT=$(kubectl get pod --namespace default $POD_NAME -o jsonpath="{.spec.containers[0].ports[0].containerPort}"); echo "Visit http://127.0.0.1:8080 to use your application"; kubectl --namespace default port-forward $POD_NAME 8080:$CONTAINER_PORT
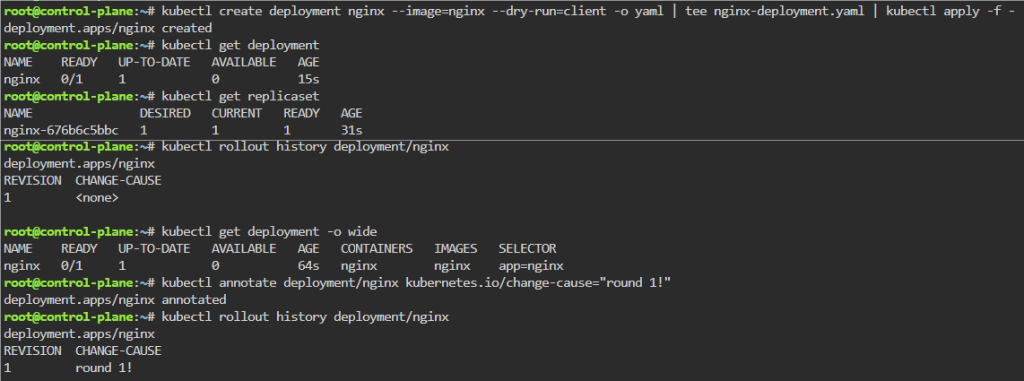
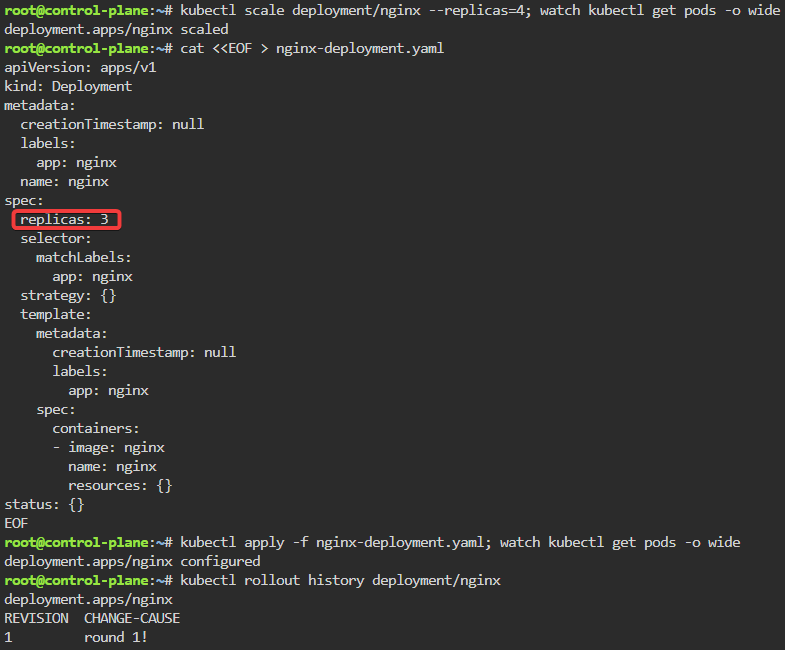
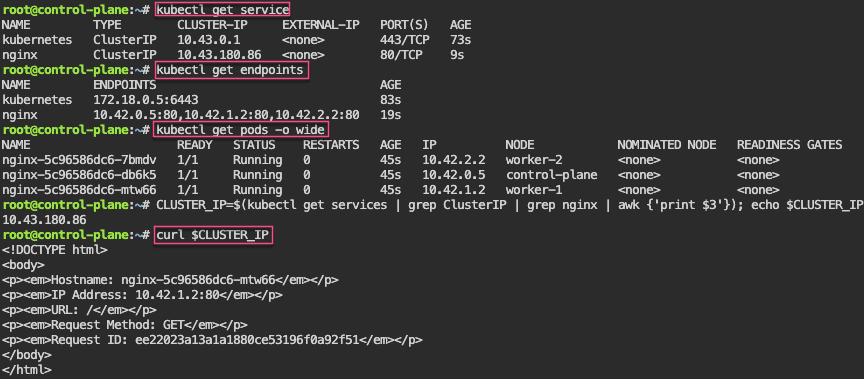
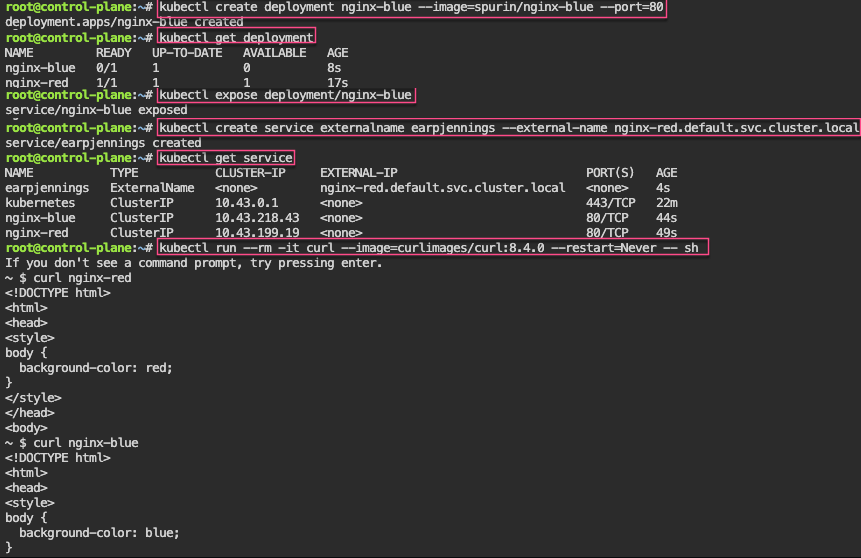
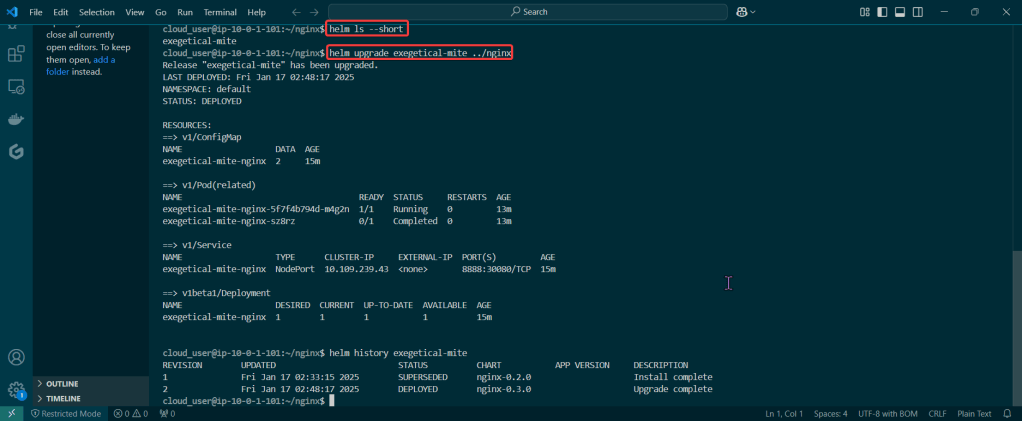
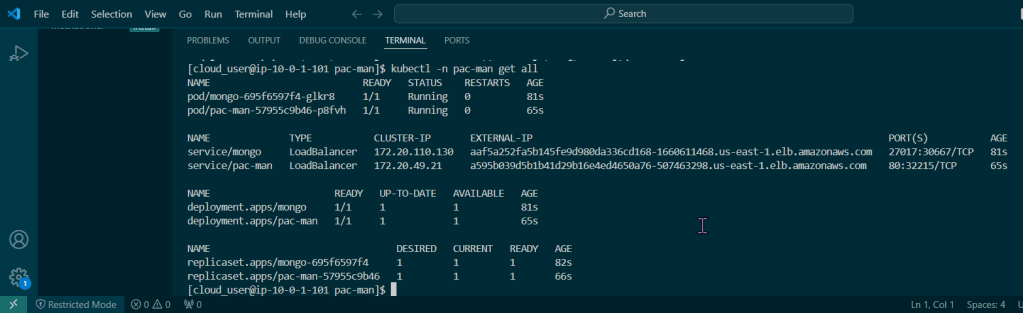
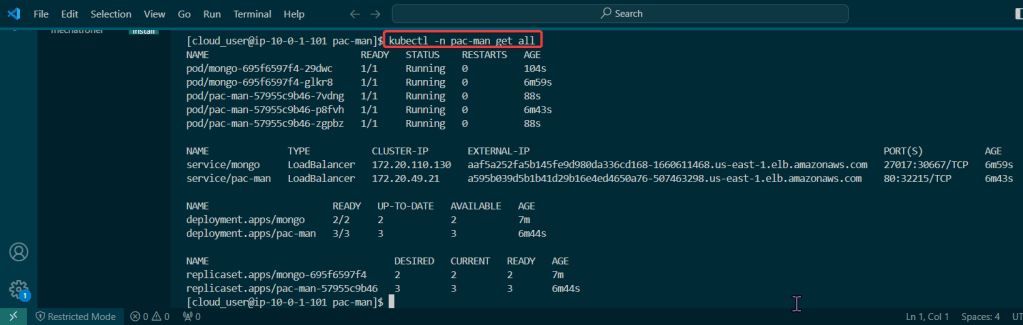
# kubectl get deployment; echo; kubectl get pods; echo; kubectl get svc
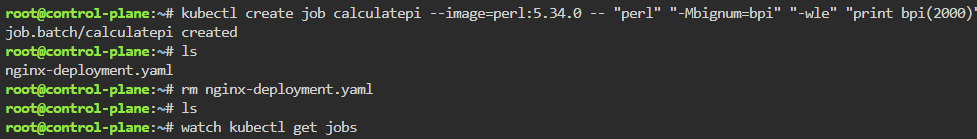
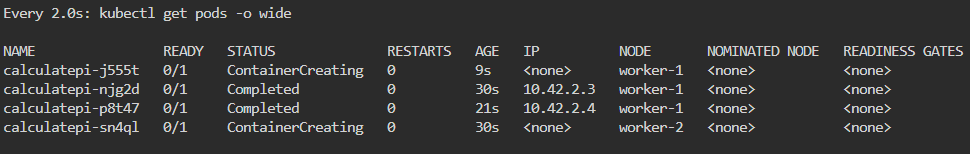
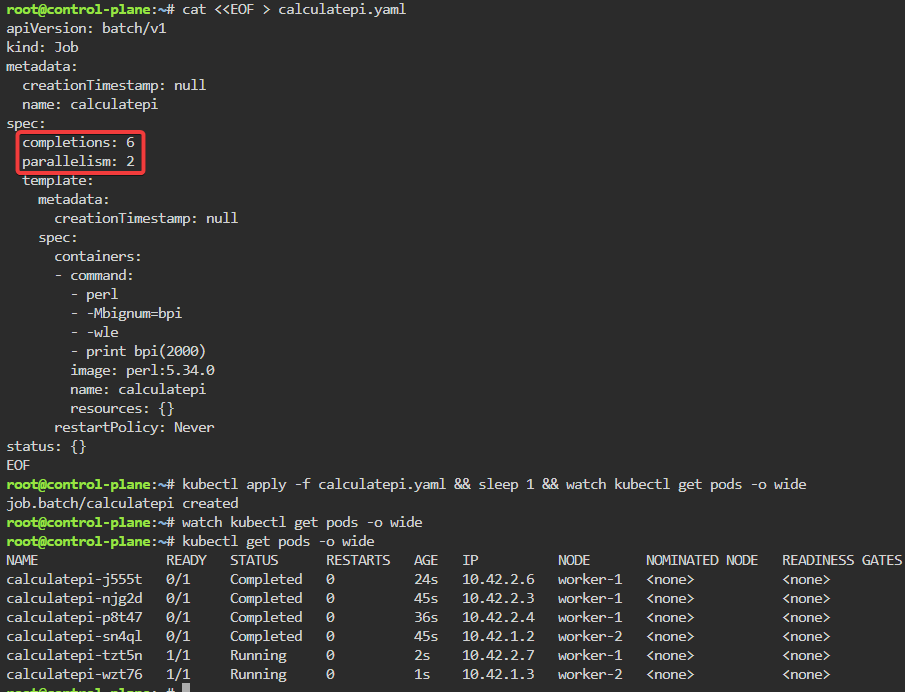
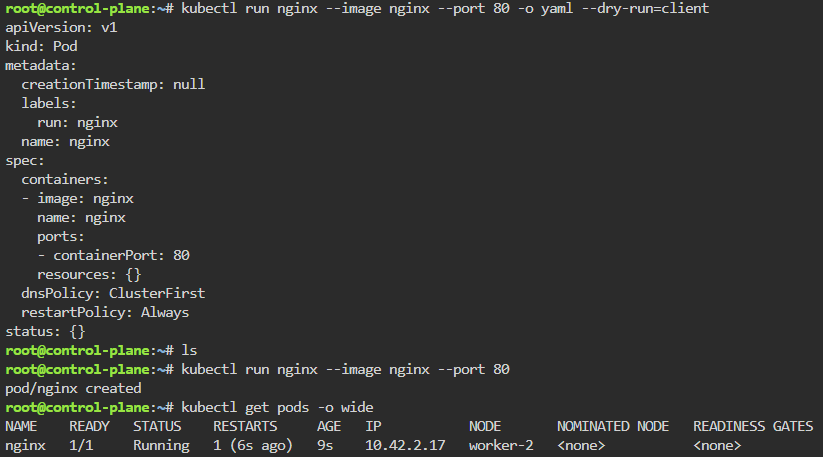
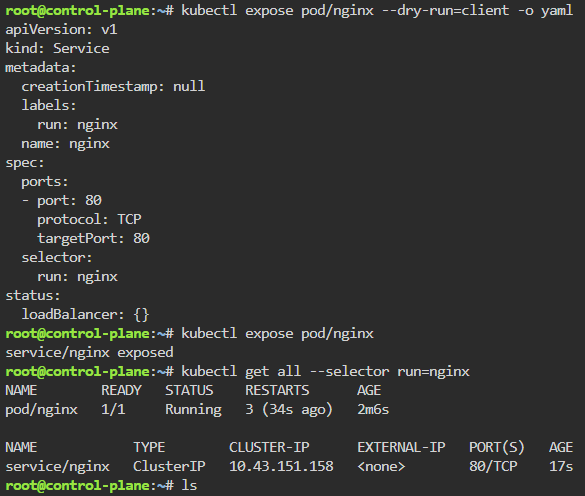
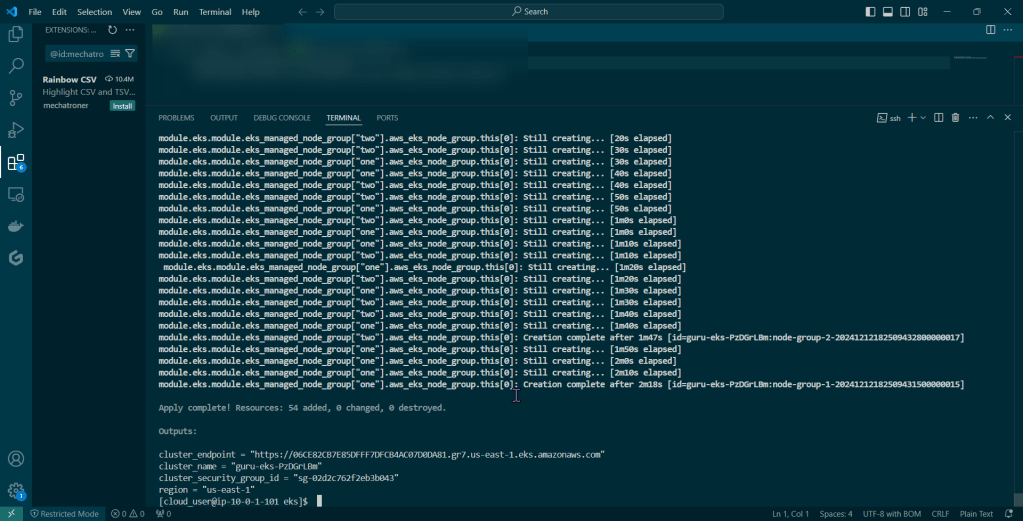
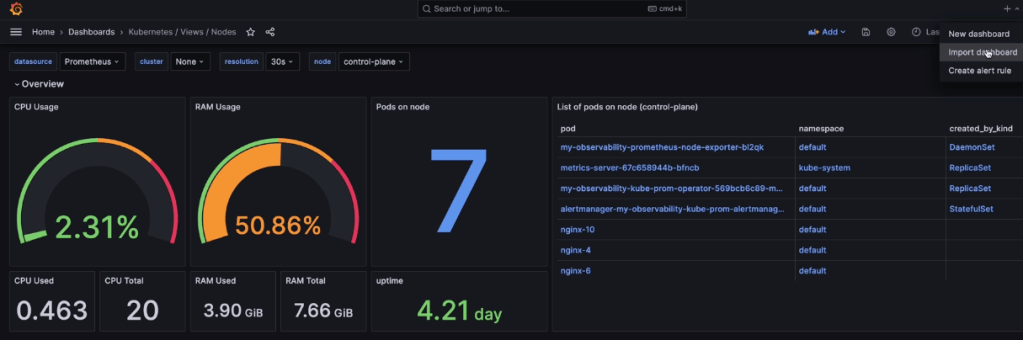
Prometheus & Grafana: 1st – add specific helm version for prometheus. 2nd – add nginx pod every 30 seconds. 3rd – then use cluster-ip to see the pods being added in prometheus & grafana.
# apt update && apt install -y git
# curl https://raw.githubusercontent.com/helm/helm/main/scripts/get-helm-3 | bash
# helm repo add prometheus-community https://prometheus-community.github.io/helm-charts
# helm search repo prometheus-community/kube-prometheus-stack -l
# helm install my-observability prometheus-community/kube-prometheus-stack --version 55.5.0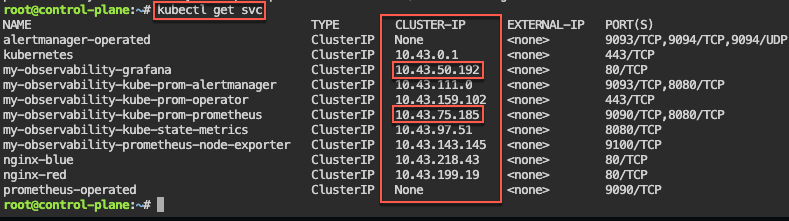
# kubectl get all -A
# kubectl get svc
# for i in {1..10}; do kubectl run nginx-${i} --image=nginx; sleep 30; done
# helm uninstall my-observability
# kubectl -n kube-system delete service/my-observability-kube-prom-kubelet --now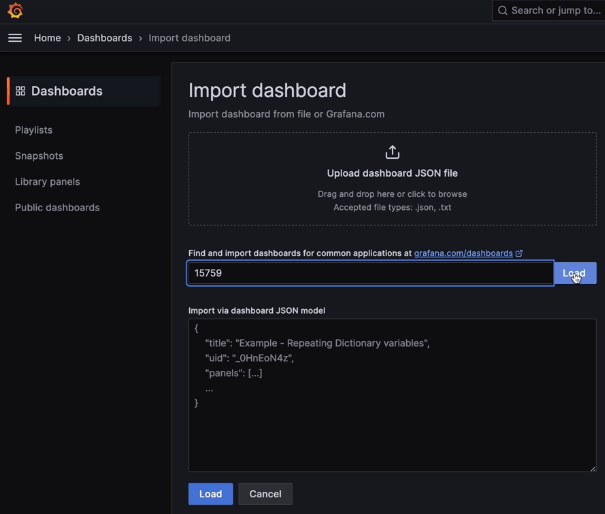
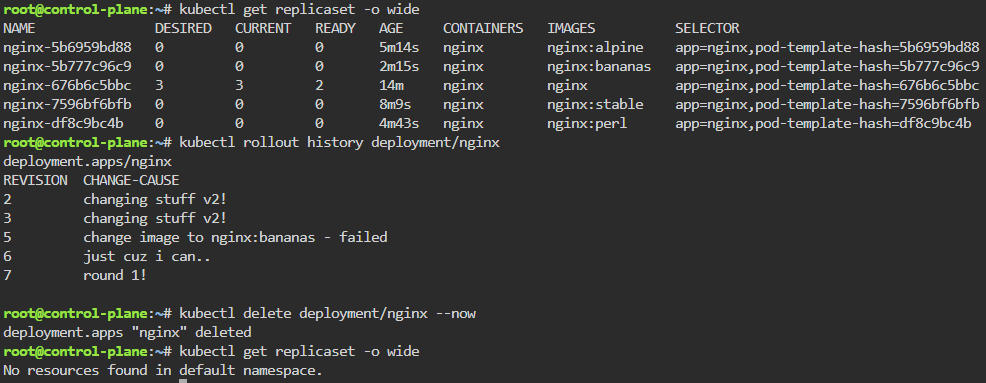
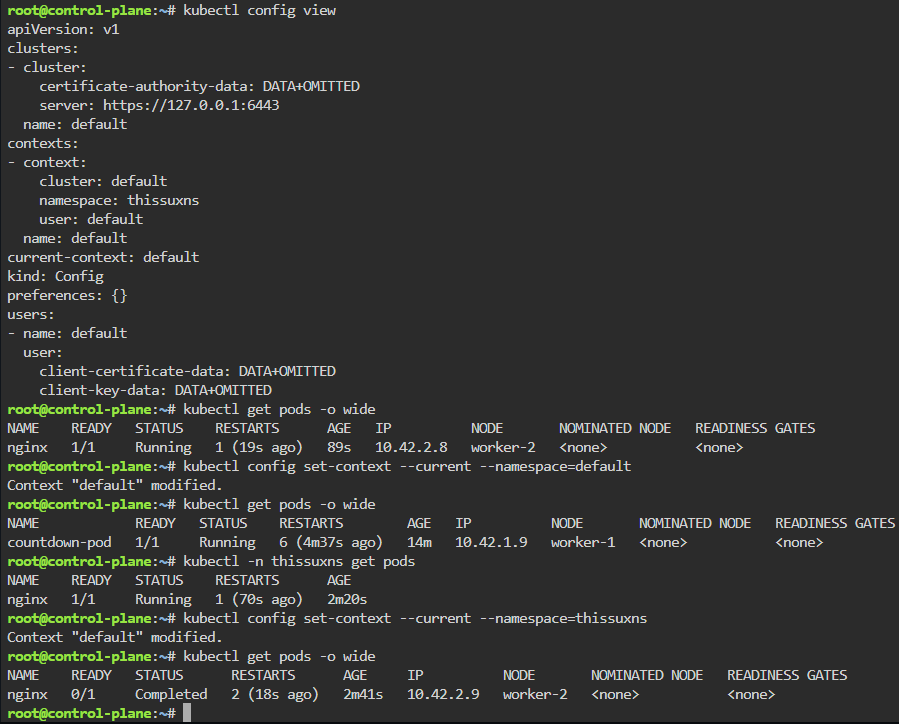
When Nodes Fail:
- Start as Healthy Nodes
- Deployment
- Stop kubelet & fail
- Documentation informs us that we wait 5 minutes before posting as unknown & evicted
- Grep to see pods moving from node to node
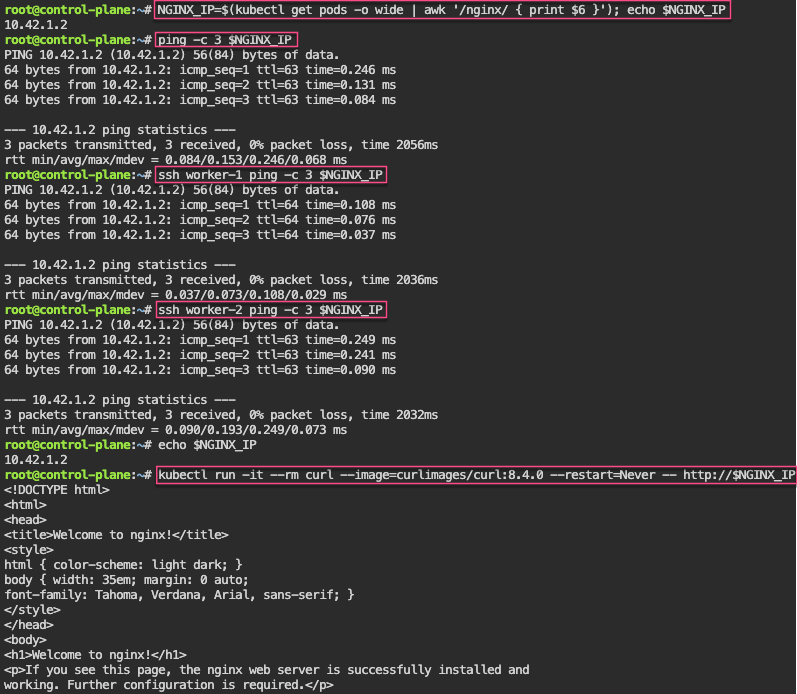
- If a node stops reporting & taking pods… it becomes NotReady, existing workload continues if permitted, after 5 minutes the node controller evicts the pods onto healthy nodes, & can describe to see the status as unknown
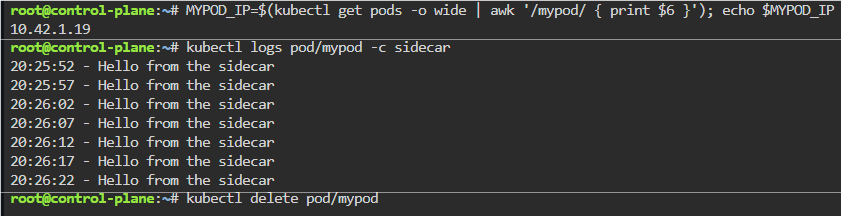
Probes & The Kubelet:
- Health Checks tell k8s what to do w/a container..
- Liveness Probe
- ARE YOU ALIVE!? if fails, kubelet restarts container
- Readiness Probe
- Ready for traffic? if fails, kubelet tells API to remove pod from svc endpt
- Does NOT restart
- Ready for traffic? if fails, kubelet tells API to remove pod from svc endpt
- Startup Probe
- Kubelet checks if application is inside the container & started
- If probe is running, liveness, & readiness checks are paused..once succeeds & probes take over
- Kubelet checks if application is inside the container & started
- Probes don’t act on their own
- Liveness Probe