Blog post includes installing K8s…GPT, see below for the goodies:

Installszz:
Github
https://github.com/k8sgpt-ai/k8sgpt
k8sgpt Docx:
https://docs.k8sgpt.ai/getting-started/in-cluster-operator/?ref=anaisurl.com
Ubuntu
# curl -LO https://github.com/k8sgpt-ai/k8sgpt/releases/download/v0.4.26/k8sgpt_amd64.deb
# sudo dpkg -i k8sgpt_amd64.deb
# k8sgpt version
# k8sgpt --help (handful of commands & flags available)
Pre-Reqzz:
Minikube
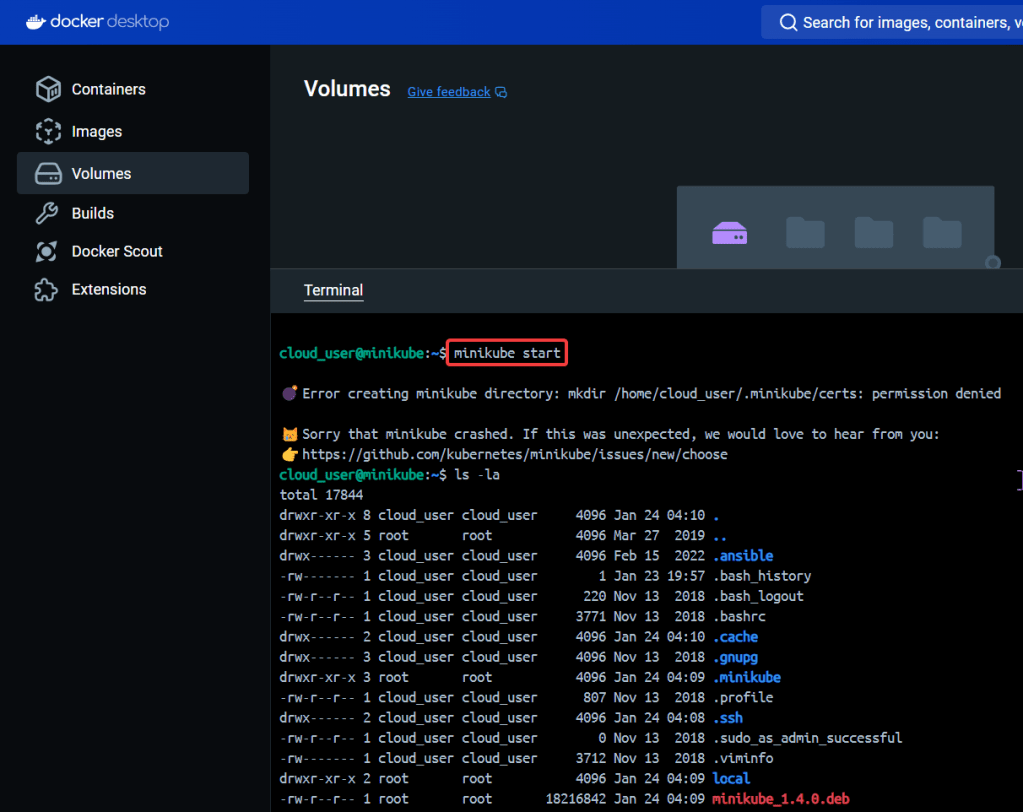
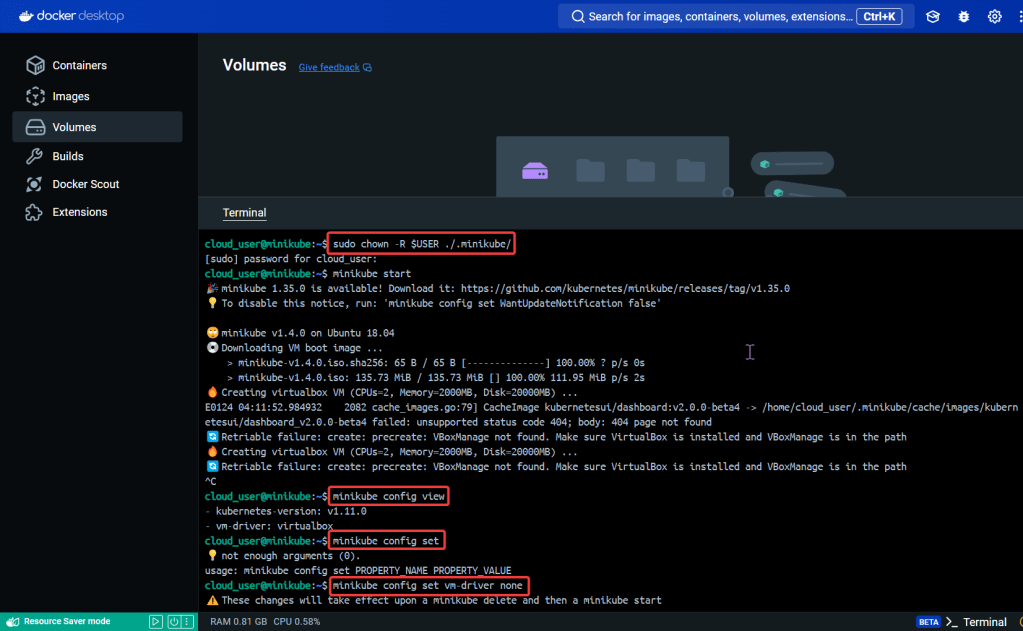
# unset KUBECONFIG
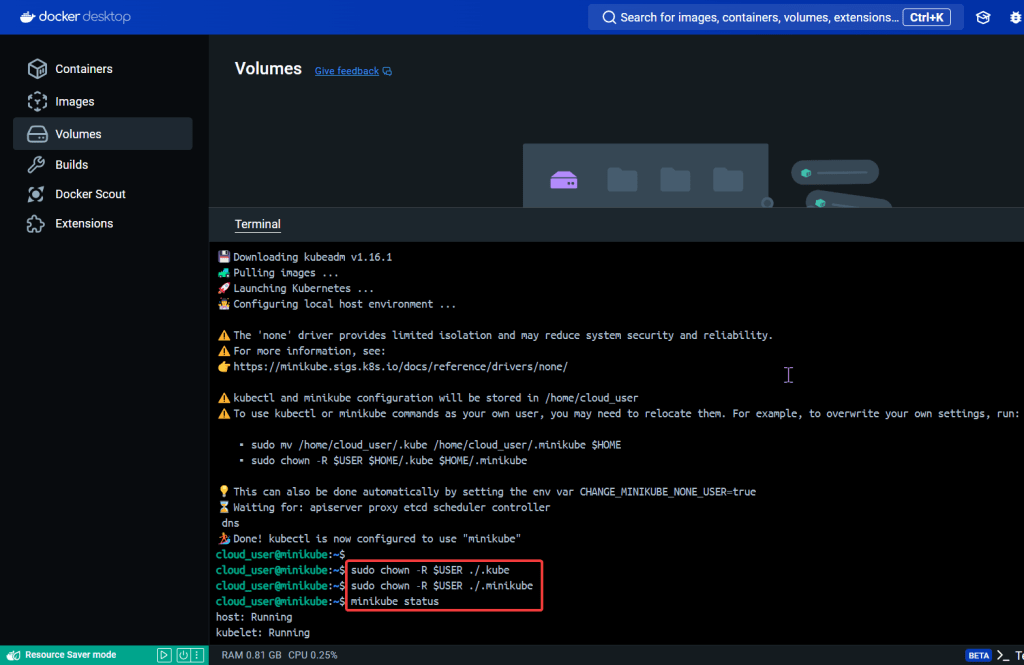
# minikube start
# minikube status
OpenAi
# https://platform.openai.com/account/api-keys
K8sgpt
# k8sgpt generate
# k8sgpt auth add openai
# k8sgpt auth list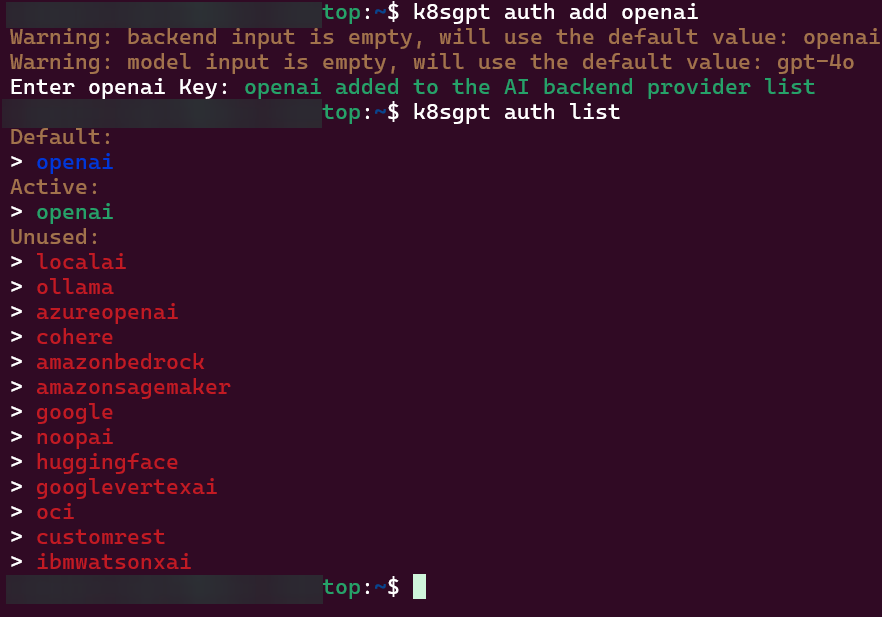
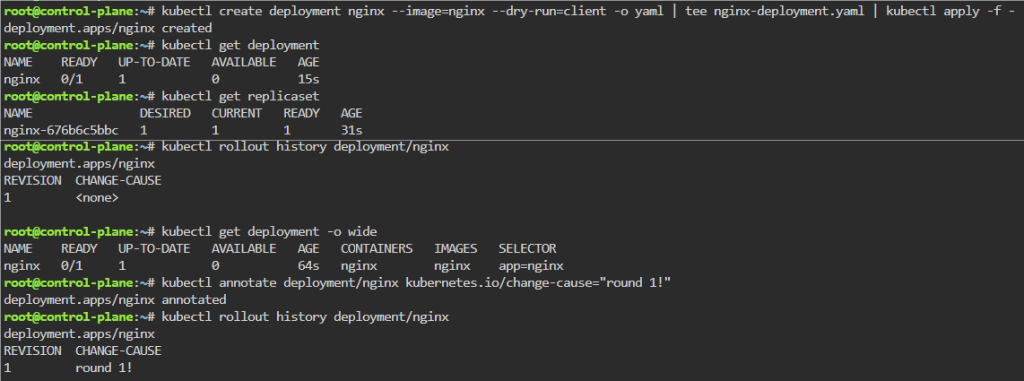
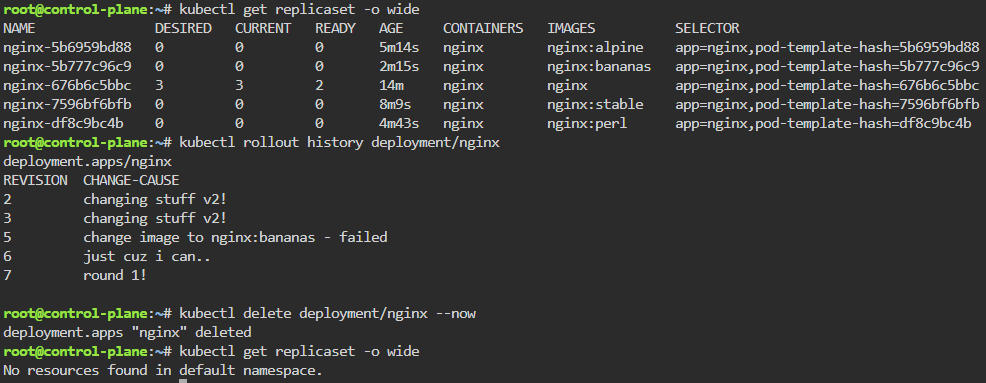
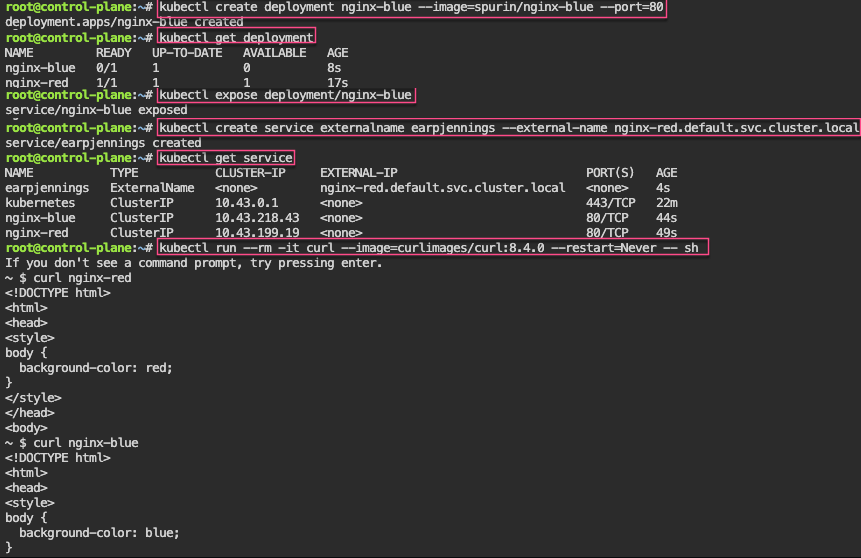
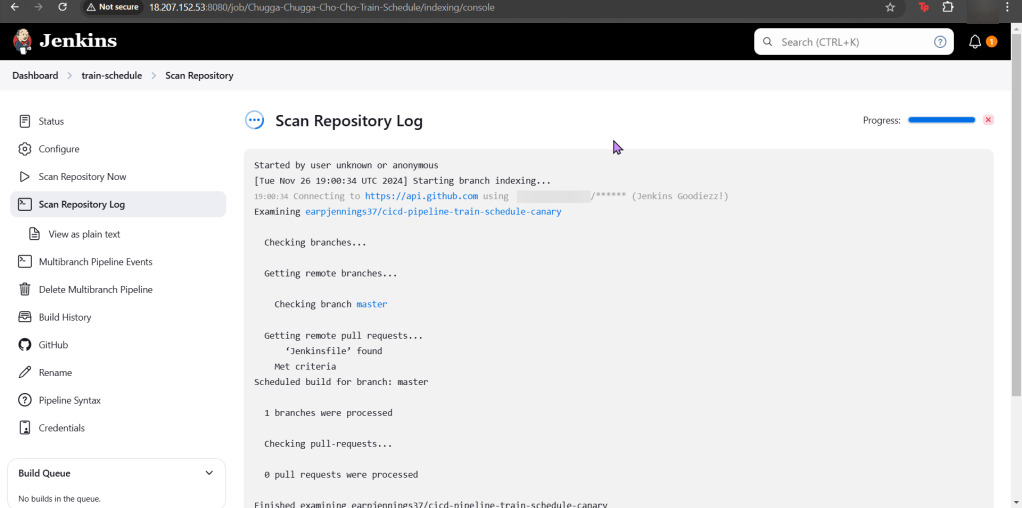
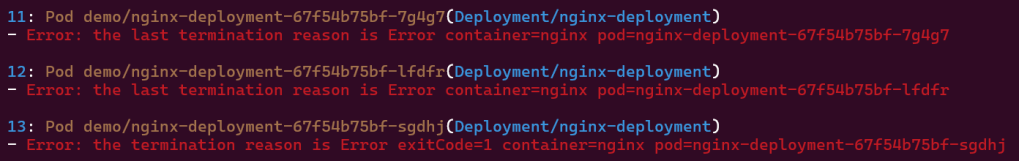
Troubleshoot why deployment is not running:
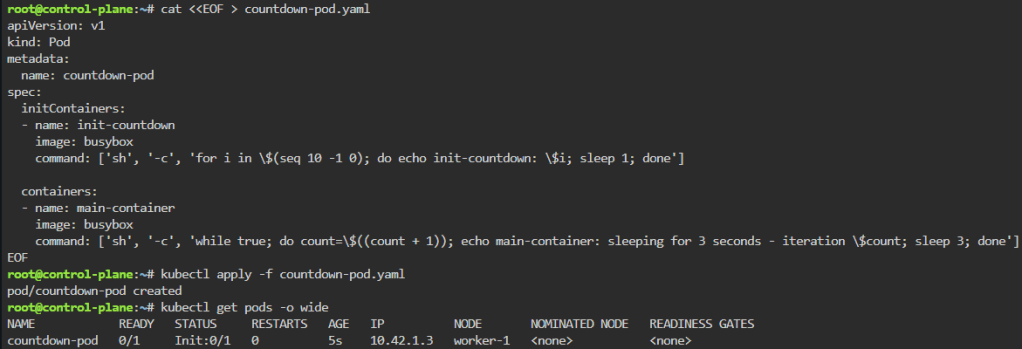
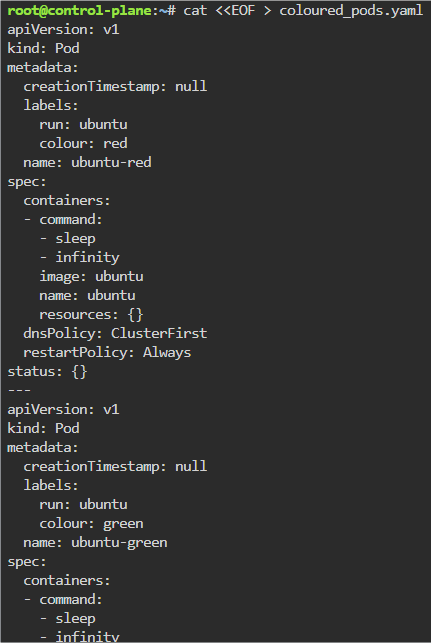
- Create yaml file
- Create namespace
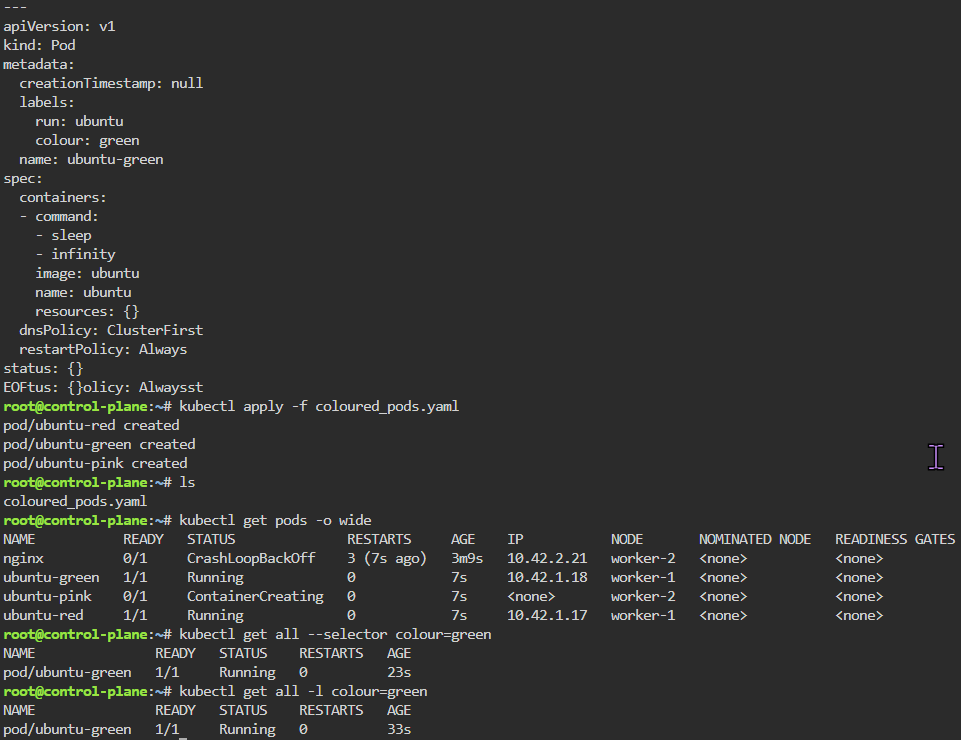
- Apply file
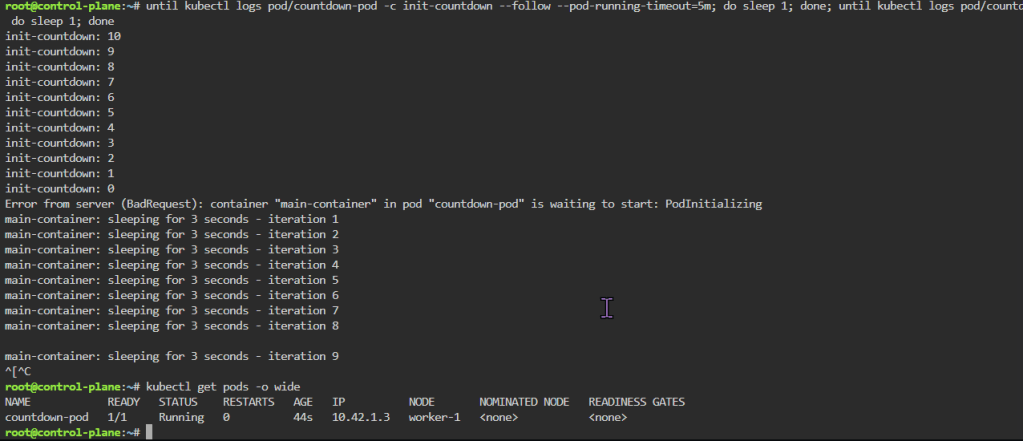
- Review K9s
- Utilize k8sgpt to see what’s going on…
2 Links to leverage:
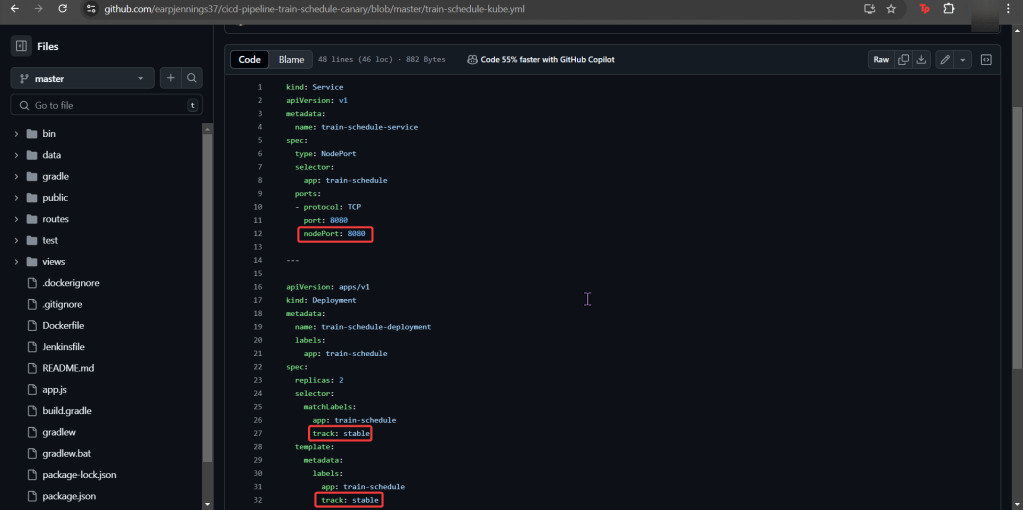
# deployment2
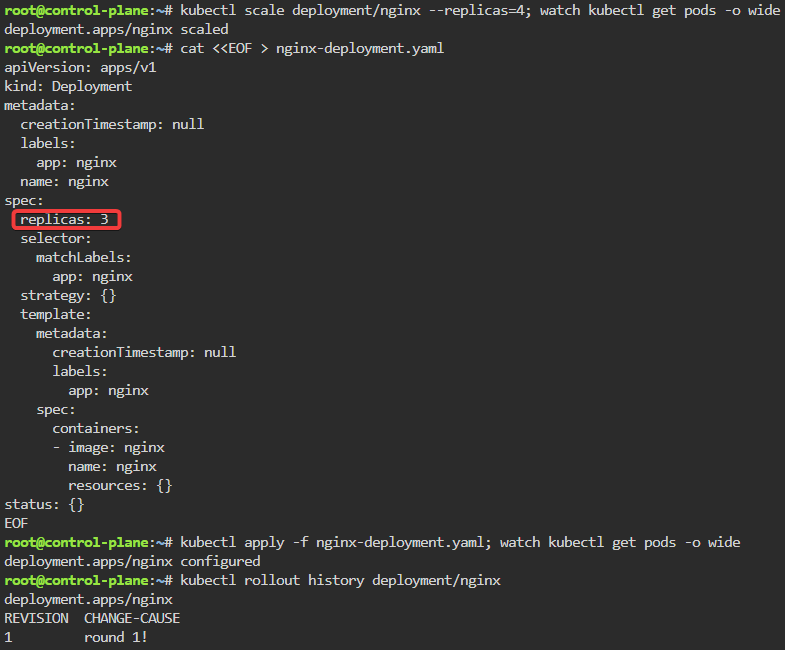
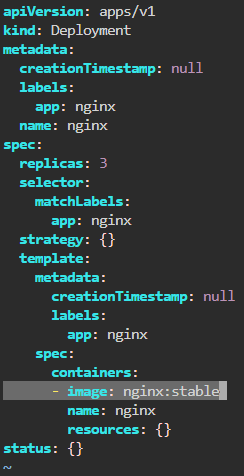
apiVersion: apps/v1
kind: Deployment
metadata:
name: nginx-deployment
labels:
app: nginx
spec:
replicas: 3
selector:
matchLabels:
app: nginx
template:
metadata:
labels:
app: nginx
spec:
containers:
- name: nginx
image: nginx:1.14.2
ports:
- containerPort: 80
securityContext:
readOnlyRootFilesystem: true# kubectl create ns demo
# kubectl apply -f deployment2 -n demo
# k8sgpt analyse
# k8sgpt analyse --explain
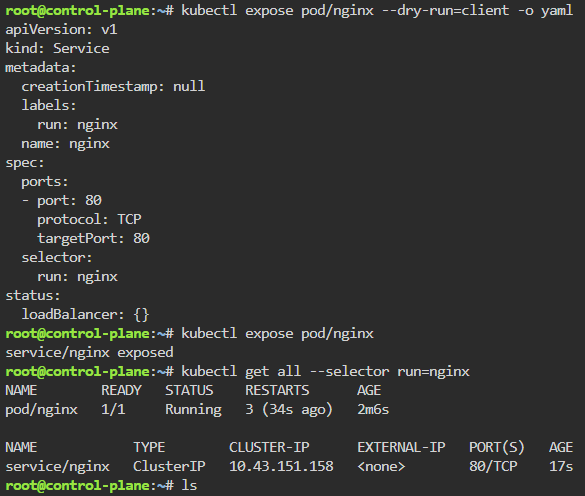
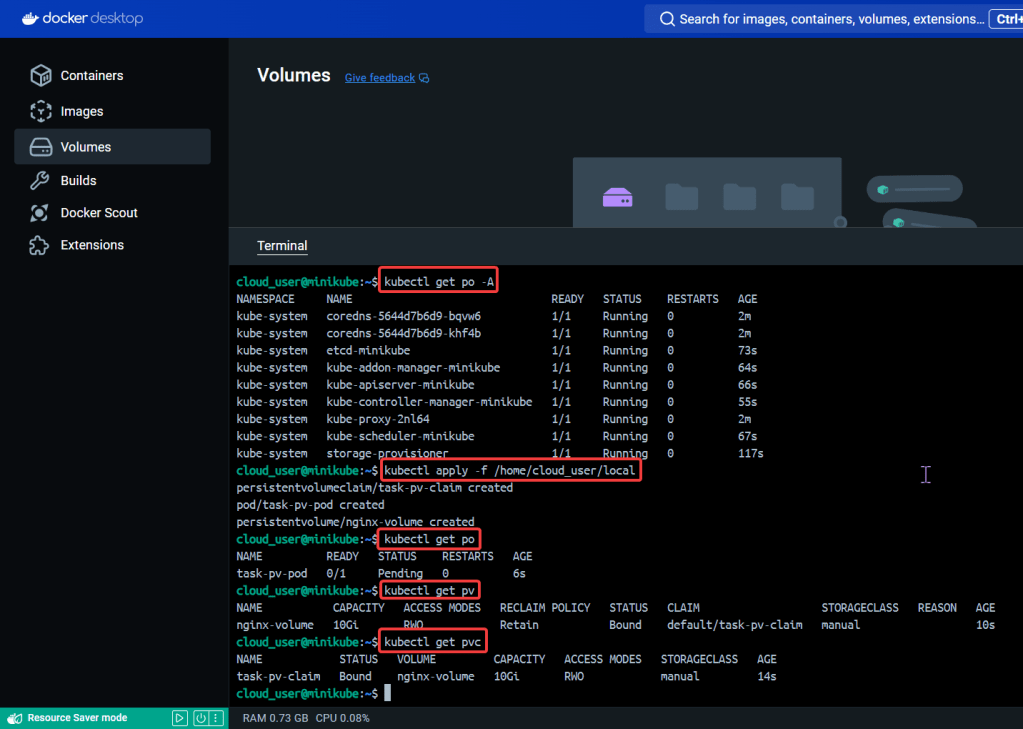
Set pods, deployments, etc w/the following commands
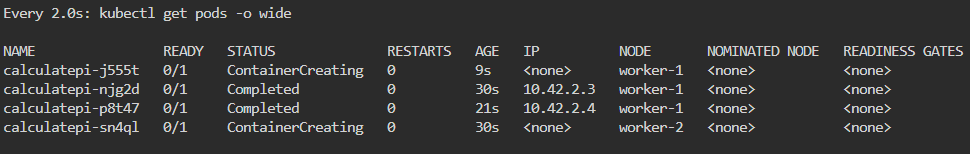
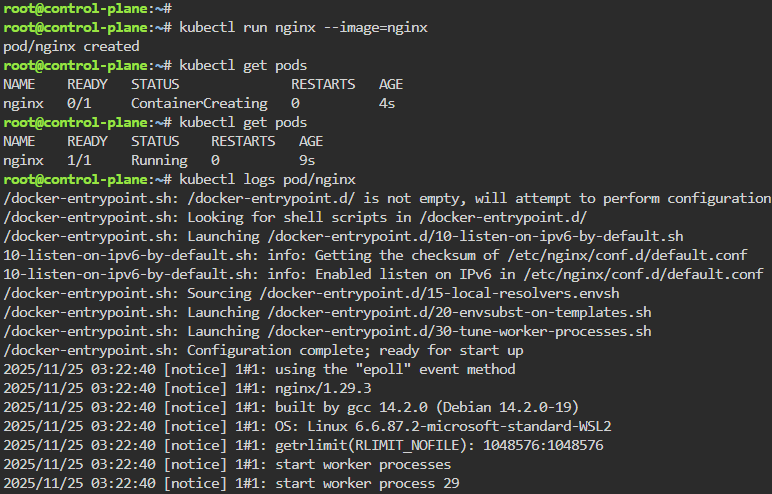
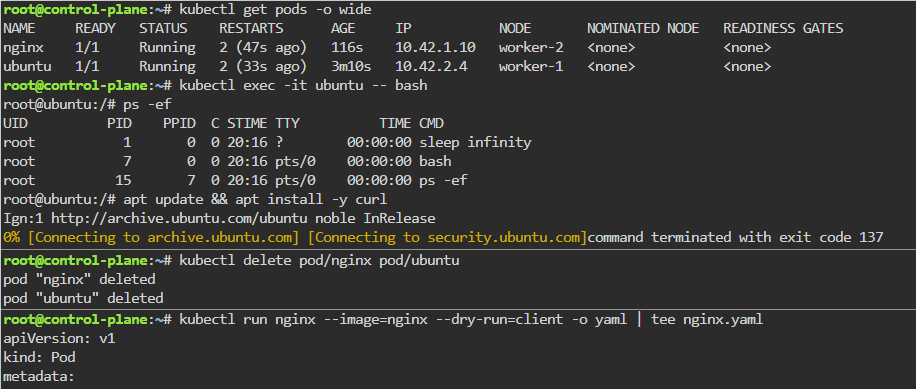
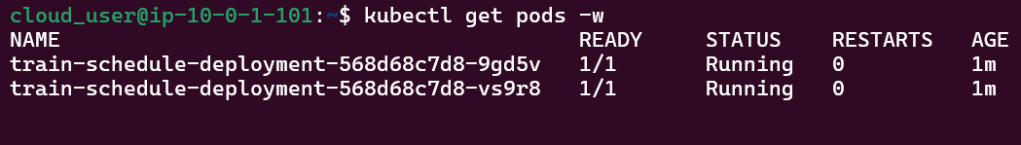
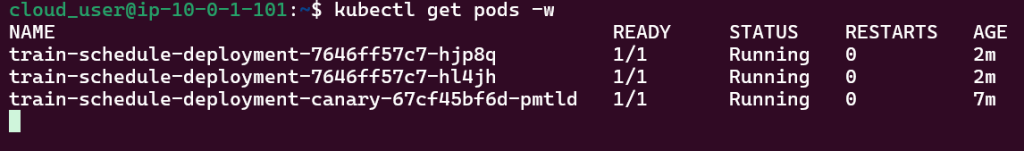
# kubectl get pods -n demo
# kubectl get pods -A
# kubectl get deployments -n demo
# kubectl get pods --all-namespaces# k8sgpt integration list
# k8sgpt filters list
# k8sgpt analyse --filter=VulnerabilityReport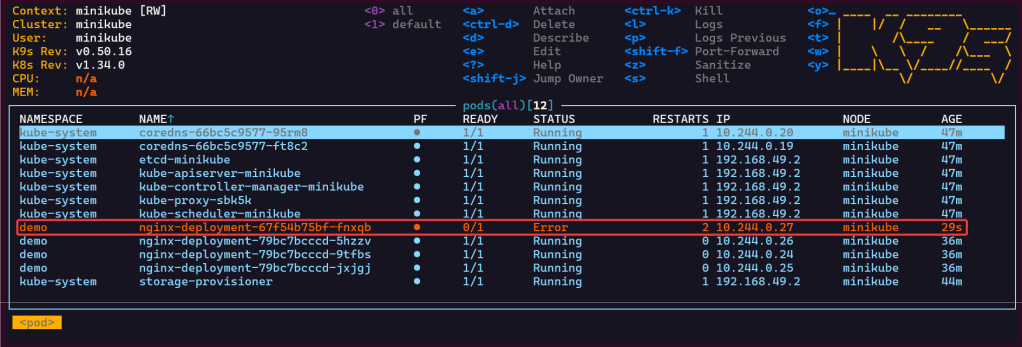
# vi deployment2
# kubectl apply -f deployment2 -n demo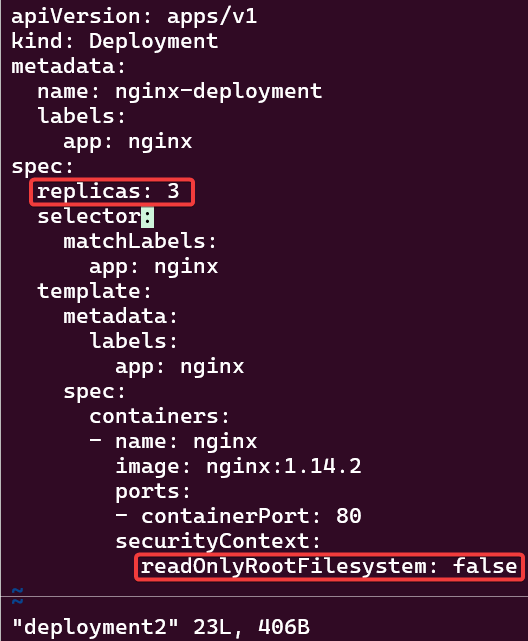
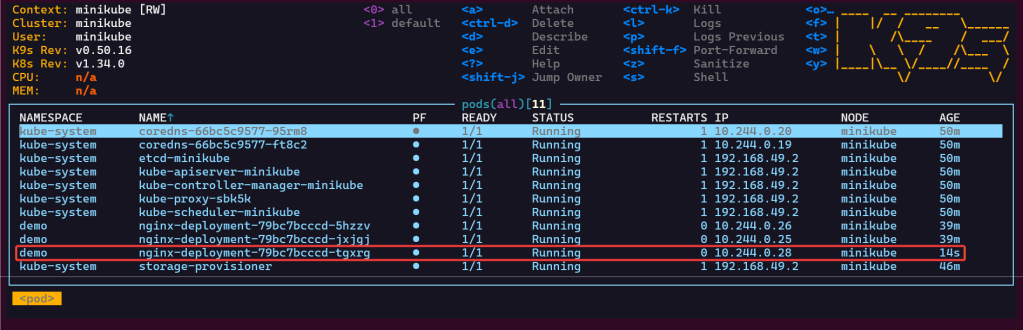
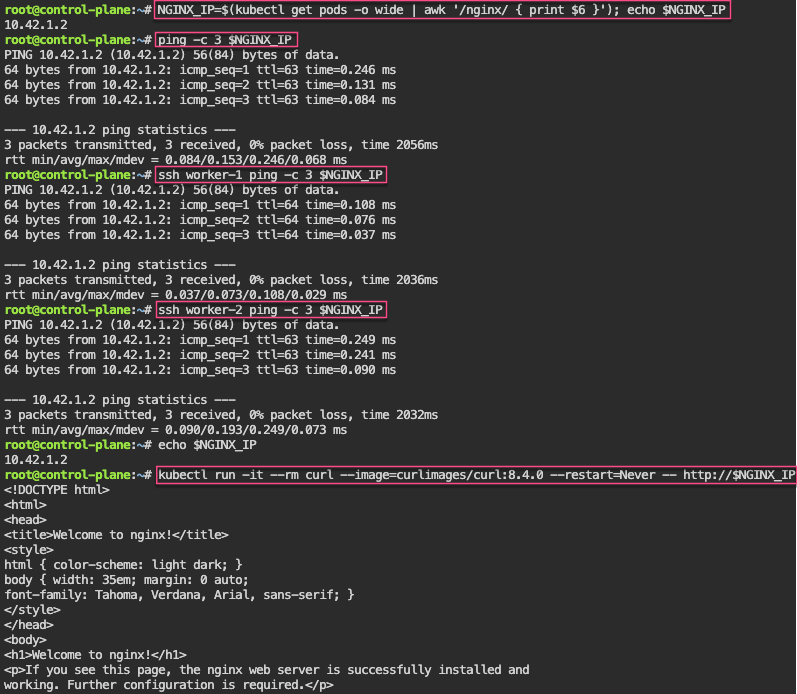
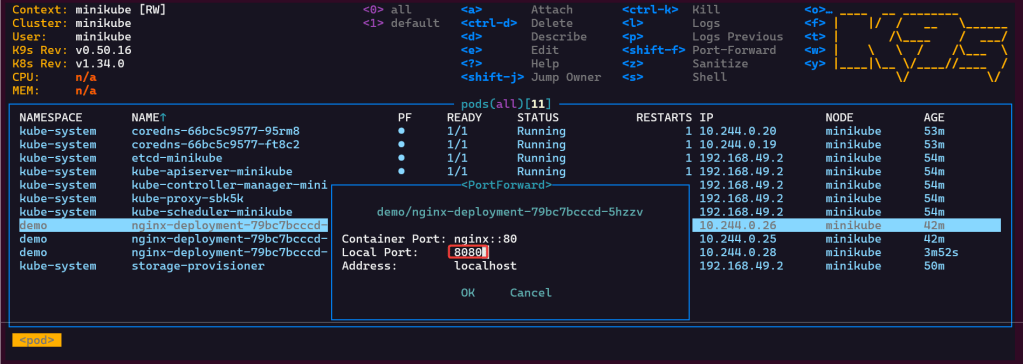
- port-forward to ensure can access pod

K8s Operator:
# brew install helm
# helm repo add k8sgpt https://charts.k8sgpt.ai/
# helm repo update
# helm install release k8sgpt/k8sgpt-operator -n k8sgpt-operator-system --create-namespace --values values.yaml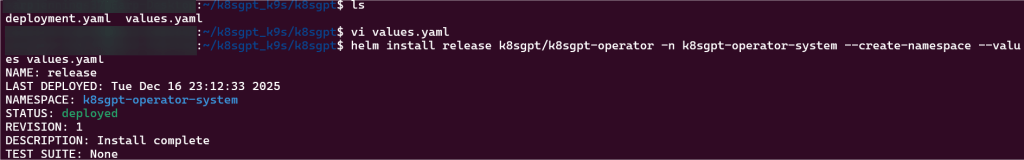
Commands to see if your new ns installed:
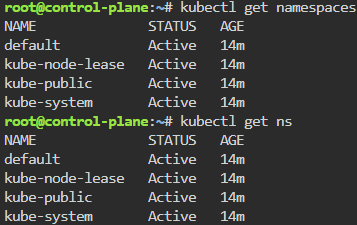
# kubectl get ns
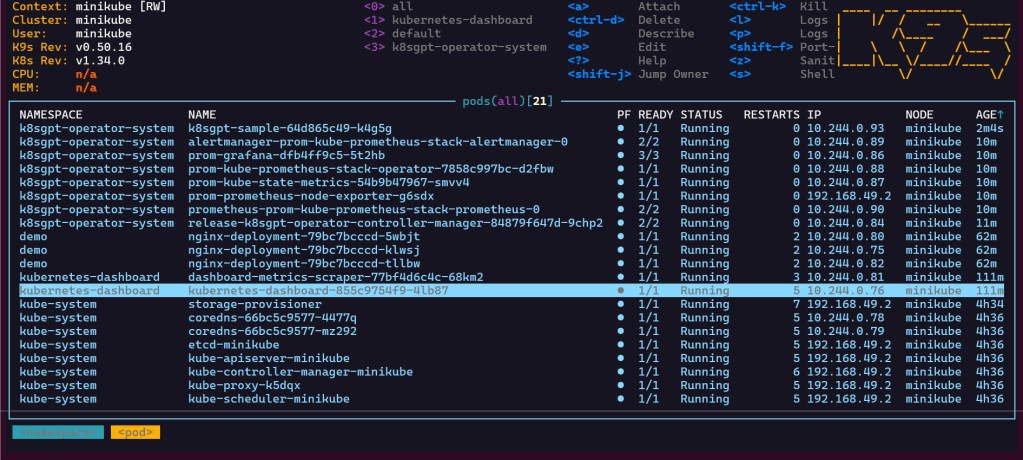
# kubectl get pods -n k8sgpt-operator-system
# k9s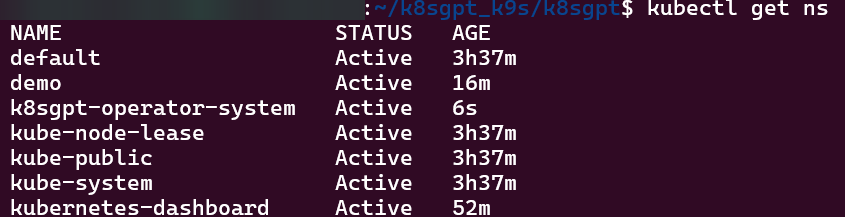
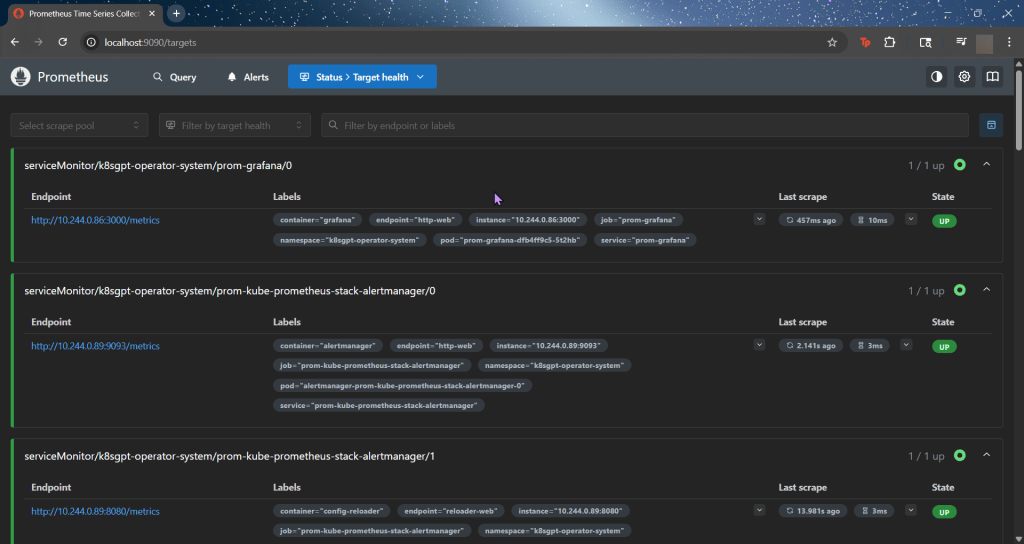
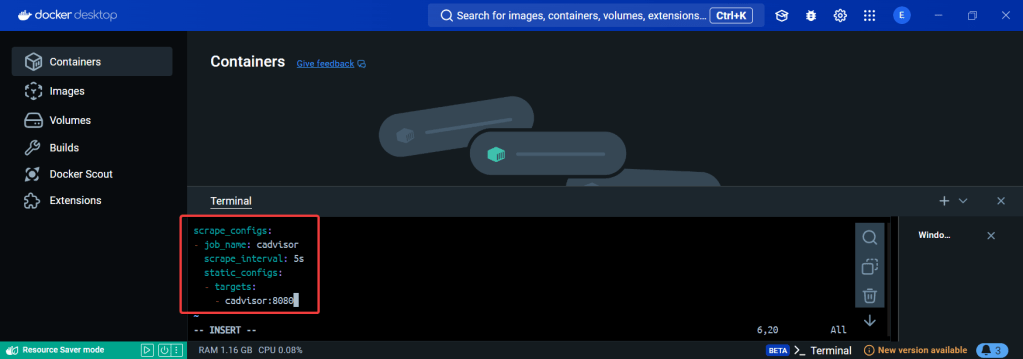
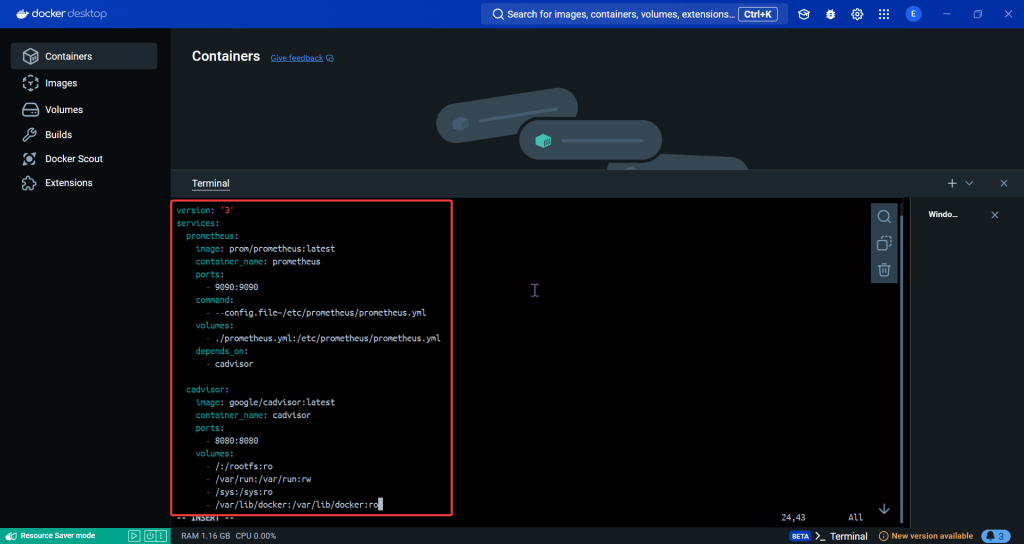
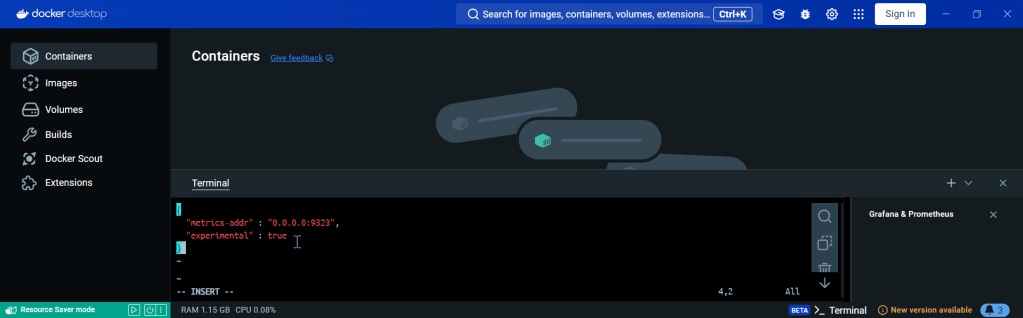
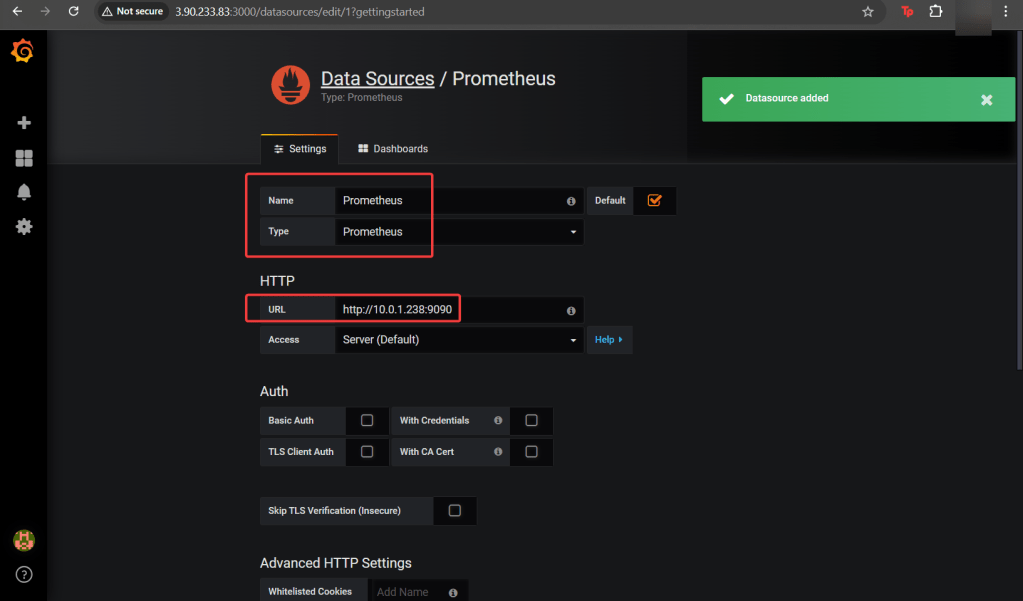
ServiceMonitor to send reports to Prometheus & create DB for K8sgpt:
# helm repo add prometheus-community https://prometheus-community.github.io/helm-charts
# kube-prometheus-stack has been installed. Check its status by running:
kubectl --namespace k8sgpt-operator-system get pods -l "release=prom"
Commands to squirrel away:
- Get Grafana 'admin' user password by running:
# kubectl --namespace k8sgpt-operator-system get secrets prom-grafana -o jsonpath="{.data.admin-password}" | base64 -d ; echo
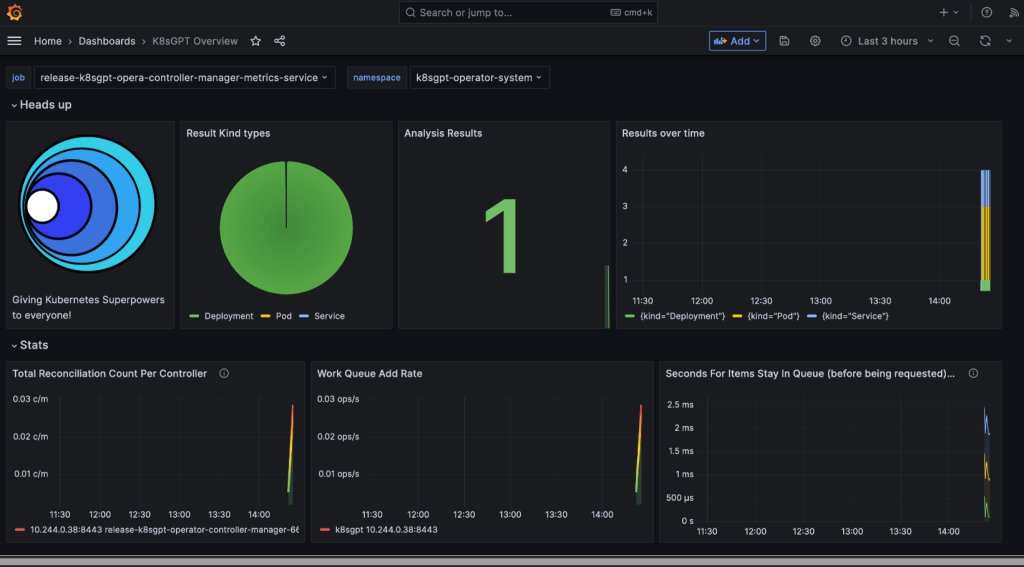
- Access Grafana local instance:
# export POD_NAME=$(kubectl --namespace k8sgpt-operator-system get pod -l "app.kubernetes.io/name=grafana,app.kubernetes.io/instance=prom" -oname)
kubectl --namespace k8sgpt-operator-system port-forward $POD_NAME 3000
- Get your grafana admin user password by running:
kubectl get secret --namespace k8sgpt-operator-system -l app.kubernetes.io/component=admin-secret -o jsonpath="{.items[0].data.admin-password}" | base64 --decode ; echOpenAi API-Keyz for K8s Secret:
# export OPENAI_TOKEN=<YOUR API KEY HERE>
# kubectl create secret generic k8sgpt-sample-secret --from-literal=openai-api-key=$OPENAI_TOKEN -n k8sgpt-operator-system
#
apiVersion: core.k8sgpt.ai/v1alpha1
kind: K8sGPT
metadata:
  name: k8sgpt-sample
  namespace: k8sgpt-operator-system
spec:
  ai:
    enabled: true
    model: gpt-4o-mini
    backend: openai
    secret:
      name: k8sgpt-sample-secret
      key: openai-api-key
  noCache: false
  version: v0.4.26
# kubectl apply -f k8sgpt-resource.yaml -n k8sgpt-operator-system
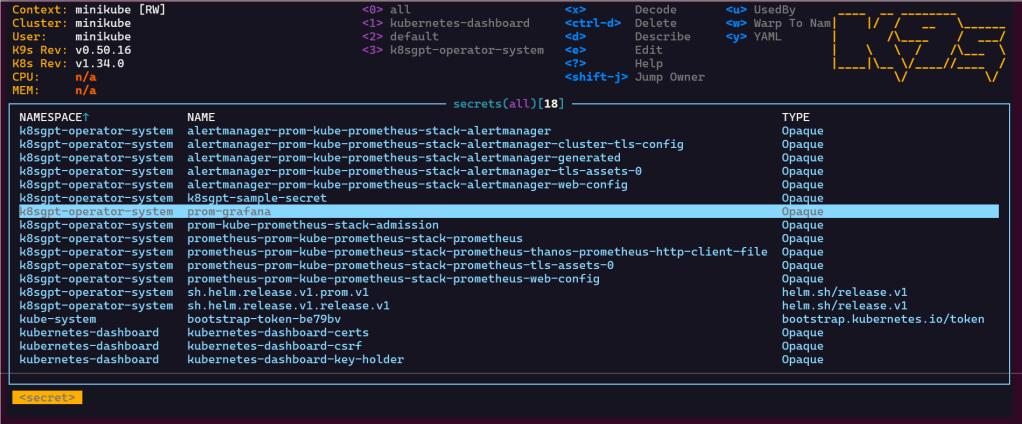
k9s
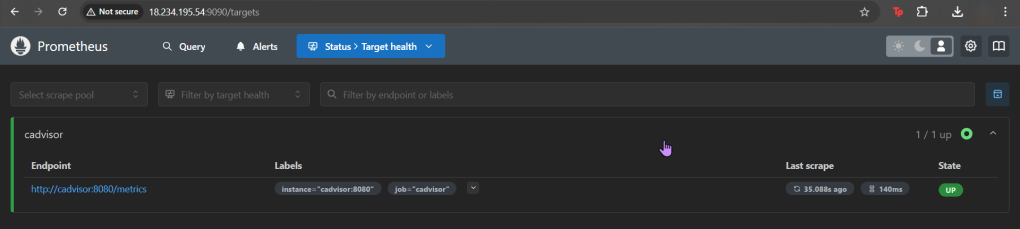
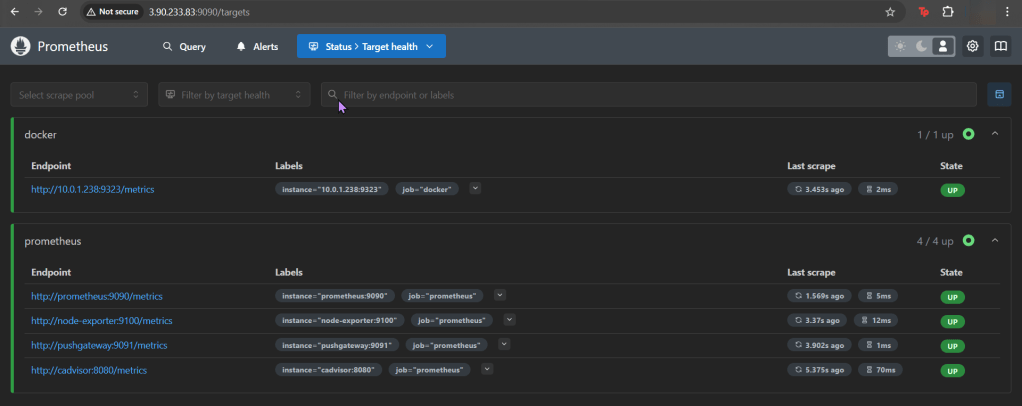
- services, shift-f, port-forward prometheus-operated:9090
# kubectl get results -n k8sgpt-operator-system
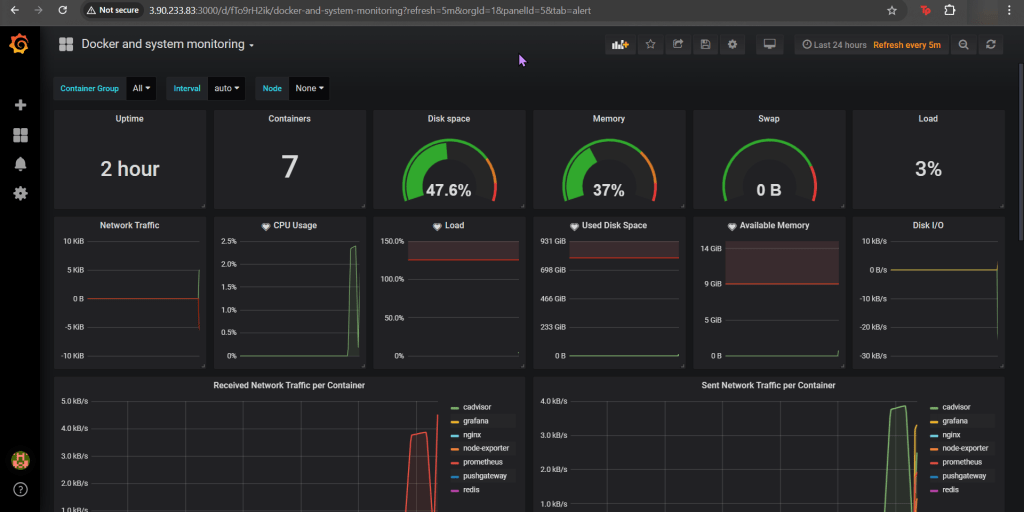
# kubectl port-forward service/prom-grafana -n prom 3000:80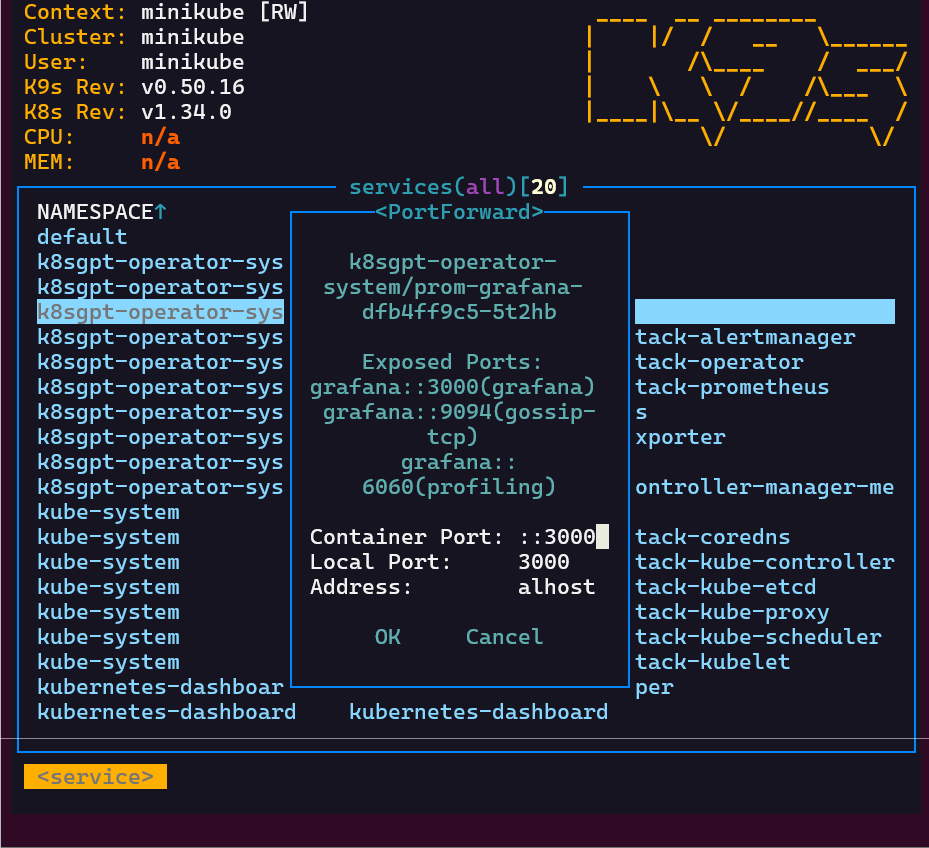
Finding grafana password
- secrets & press-x