
Series of blog posts show progress of updating/adding to EKS Cluster, this post covers adding connecting Grafana w/Prometheus, Loki, Tempo, & Thanos for further {Allow} Telemetry Network Policies. See below for past posts:
- Documentation Used
- AWS
- K8s
Network Policies:
- Network Policy work only if CNI enforce, so I enabled the network-policy. I created a folder called “Network-Policy” w/all the Telemetry & Observation tools under it.
- Below is a summary flow of what is attempted to be connected
Prometheus → node-exporter
Prometheus → kube-state-metrics
Prometheus → operator metrics
Prometheus → Kubernetes API / kubelet metrics
Grafana → Prometheus
Grafana → Loki
Grafana → Tempo
Thanos Query → Store Gateway
Thanos Query → Prometheus Thanos sidecar
Prometheus Thanos sidecar → S3
Store Gateway → S3
Pods → DNS
network-policies.yaml:
- Monitoring-root already watches applications so ARgocd discovers application & deplys under apps/network-policies.
allow-dns.yaml:
- Every pod needs CoreDNS
allow-grafana-to-prometheus:
- Grafana can reach Prometheus on port 9090. Labels are:
- app.kubernetes.io/name=grafana
- app.kubernetes.io/name=prometheus
- Coudl be loki or loki-gateway, so that affects gateway labels.
allow-grafana-to-tempo:
- Typically Tempo exposes HTTP query endpoints from OTLP recieving ports.
allow-thanos-egress:
- IRSA IAM Policy — > S3 Gateway Endpoint Policy
1. git add applications/network-policies.yaml apps/network-policies/2. kubectl annotate application monitoring-root -n argocd \ argocd.argoproj.io/refresh=hard --overwriteapplication.argoproj.io/monitoring-root annotated3. kubectl get applications -n argocd -wNAME SYNC STATUS HEALTH STATUSbootstrap-root Synced Healthykube-prometheus-stack Synced Healthyloki Synced Healthymetrics-server Synced Healthymonitoring-root Synced Healthynetwork-policies Synced Healthytempo Synced Healthythanos Synced Healthy4. kubectl get networkpolicy -n monitoringNAME POD-SELECTOR AGEallow-grafana-to-loki app.kubernetes.io/component=gateway,app.kubernetes.io/name=loki 11mallow-grafana-to-prometheus app.kubernetes.io/name=prometheus 11mallow-grafana-to-tempo app.kubernetes.io/name=tempo 11mthanos-query app.kubernetes.io/component=query,app.kubernetes.io/instance=thanos,app.kubernetes.io/name=thanos 179mthanos-storegateway app.kubernetes.io/component=storegateway,app.kubernetes.io/instance=thanos,app.kubernetes.io/name=thanos 179m
Port-Forwarding Allowing the Internal Policies:
- After git push, have 2 options – either in CLI or ArgoCD Ui:
1. kubectl annotate application network-policies -n argocd \ argocd.argoproj.io/refresh=hard --overwriteapplication.argoproj.io/network-policies annotated---------------------------------------------------------------2. ArgoCD -- > Refresh -- > Hard Refresh
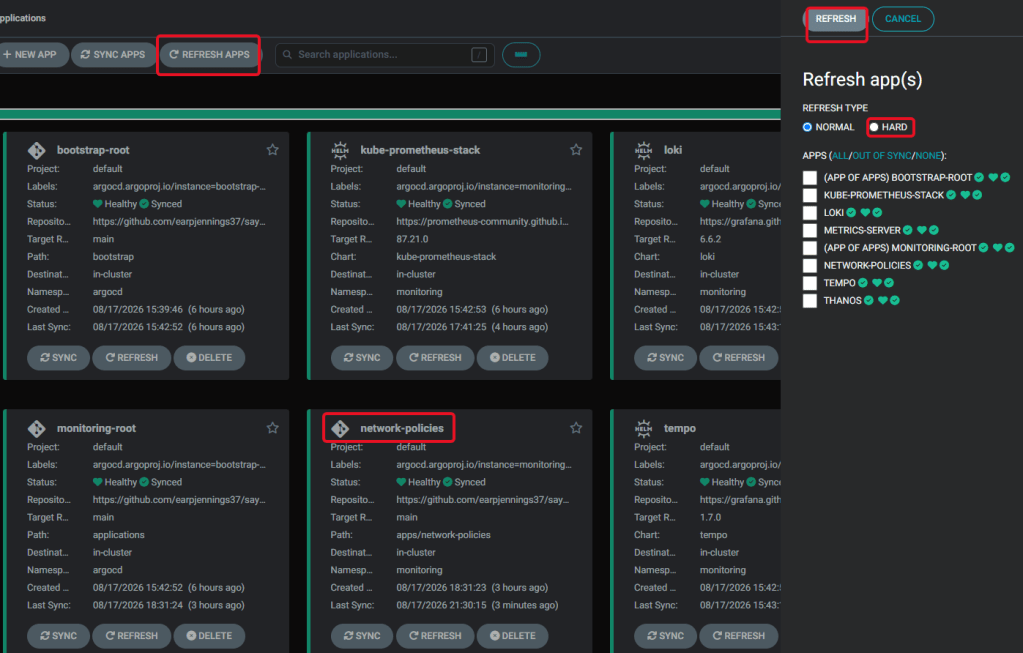
- 2 options to either run CLI or use K9s to view synced/healthy applications
kubectl get applications -n argocd

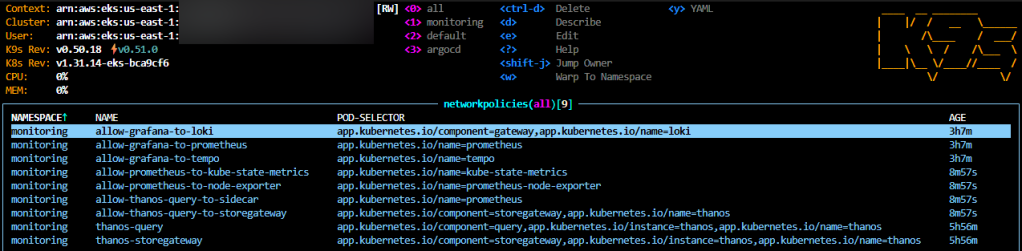
- 2 options to use CLI or K9s to view network policies you added
kubectl get networkpolicy -n monitoringNAME POD-SELECTOR AGEallow-grafana-to-loki app.kubernetes.io/component=gateway,app.kubernetes.io/name=loki 3h6mallow-grafana-to-prometheus app.kubernetes.io/name=prometheus 3h6mallow-grafana-to-tempo app.kubernetes.io/name=tempo 3h6mallow-prometheus-to-kube-state-metrics app.kubernetes.io/name=kube-state-metrics 7m51sallow-prometheus-to-node-exporter app.kubernetes.io/name=prometheus-node-exporter 7m51sallow-thanos-query-to-sidecar app.kubernetes.io/name=prometheus 7m51sallow-thanos-query-to-storegateway app.kubernetes.io/component=storegateway,app.kubernetes.io/name=thanos 7m51sthanos-query app.kubernetes.io/component=query,app.kubernetes.io/instance=thanos,app.kubernetes.io/name=thanos 5h55mthanos-storegateway app.kubernetes.io/component=storegateway,app.kubernetes.io/instance=thanos,app.kubernetes.io/name=thanos 5h55m
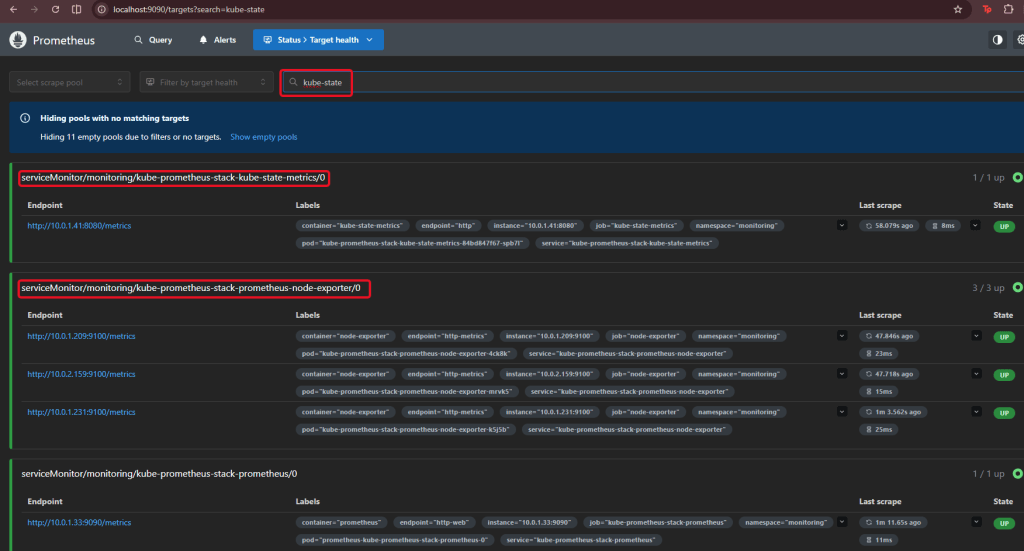
Port-Forwarding Prometheus:
1. kubectl port-forward -n monitoring \ svc/kube-prometheus-stack-prometheus 9090:90902. http://localhost:9090/targets
Thanos Query Port-Forward:
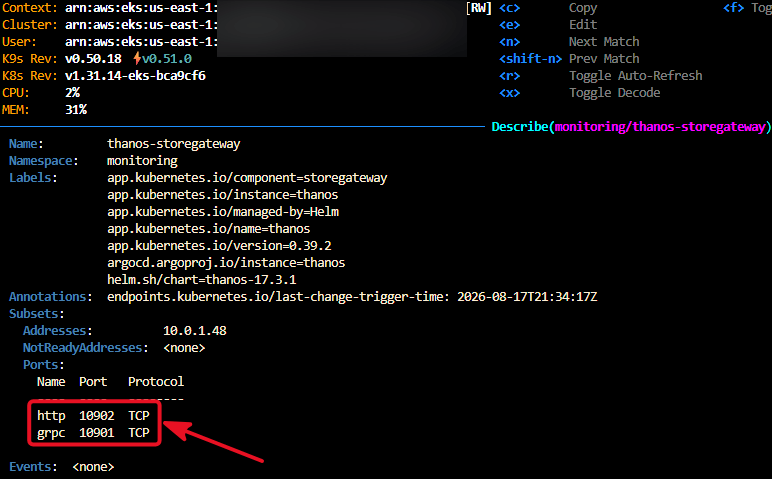
- Only 1 Endpoint, so query was not working & added stores:
# -----------------------------# Thanos Query# -----------------------------query: enabled: true replicaCount: 1 stores: - dnssrv+_grpc._tcp.thanos-storegateway.monitoring.svc.cluster.local - prometheus-operated.monitoring.svc.cluster.local:10901 resources: requests: cpu: 25m memory: 64Mi limits: cpu: 100m memory: 128Mi
- Instead of kubectl annotate …. I just used ArgoCD Ui to hard-refresh

- Can use CLI to get deployment or K9s to describe deployment & see 2 endpoints
kubectl get deployment thanos-query -n monitoring \ -o jsonpath='{.spec.template.spec.containers[0].args}' | jq[ "query", "--log.level=info", "--log.format=logfmt", "--grpc-address=0.0.0.0:10901", "--http-address=0.0.0.0:10902", "--query.replica-label=replica", "--endpoint=dnssrv+_grpc._tcp.thanos-storegateway.monitoring.svc.cluster.local", "--endpoint=dnssrv+_grpc._tcp.thanos-storegateway.monitoring.svc.cluster.local", "--endpoint=prometheus-operated.monitoring.svc.cluster.local:10901", "--alert.query-url=http://thanos-query.monitoring.svc.cluster.local:9090"
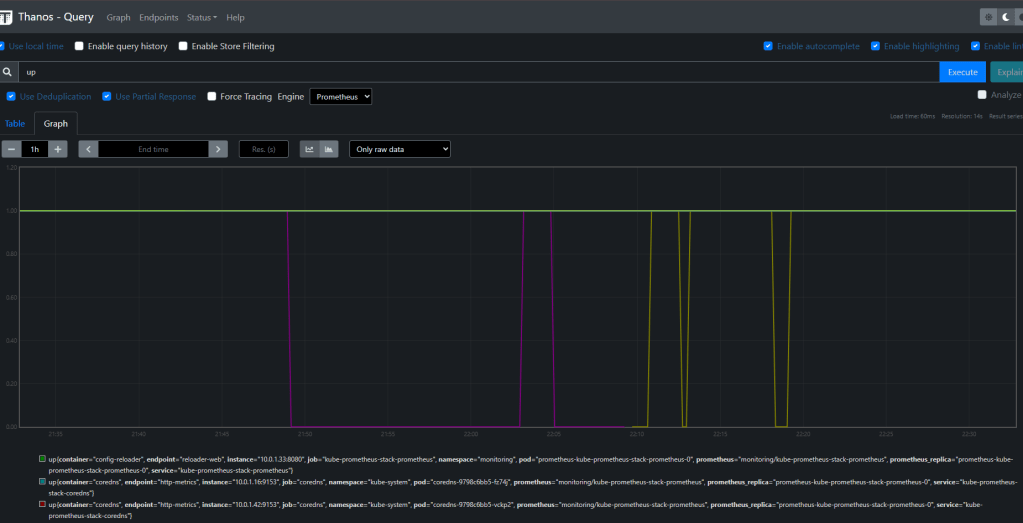
1. kubectl port-forward -n monitoring svc/thanos-query 9091:90902. http://localhost:9091
Grafana Port-Forward:

- After Port-Forwarding only saw Prometheus & Alert-Manager as Data Sources, so updated code to add Loki & Tempo.
  additionalDataSources:
    - name: Loki
      type: loki
      access: proxy
      url: http://loki-gateway.monitoring
      editable: false

    - name: Tempo
      type: tempo
      access: proxy
      url: http://tempo.monitoring:3100
editable: false- Can go to ArgoCD Ui or just use CLI as seen below…
kubectl annotate application network-policies -n argocd \ argocd.argoproj.io/refresh=hard --overwriteapplication.argoproj.io/network-policies annotated
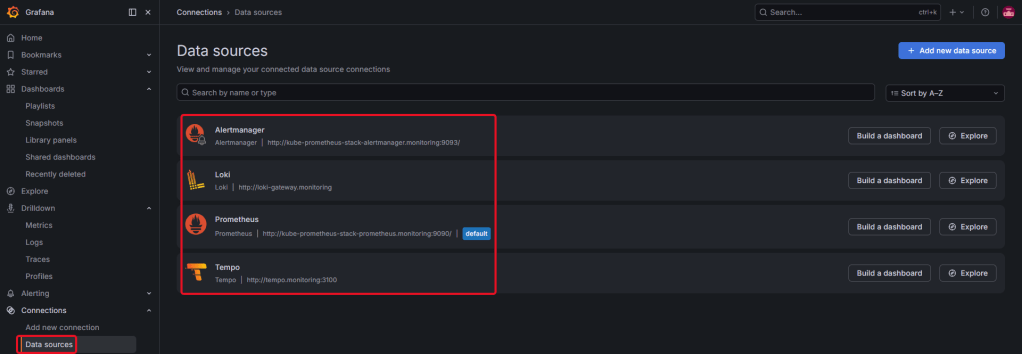
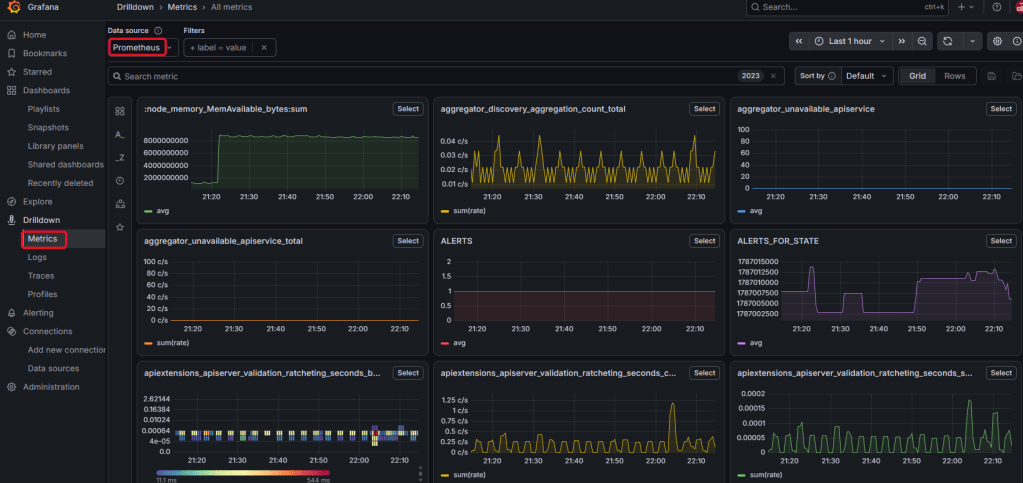
- Now can drilldown to see metrics, logs, traces, etc. from Prometheus, Loki, & Tempo.